
arc
Senior Members
-
Joined
-
Last visited
-
Well, I don't know how Bayesian I am but I predicted you would say that it would be a great topic for a thread, and I agree. Our county library system has completed a new branch within two blocks of our home and it is scheduled to open this next month. I am very exited about being able to walk down there in just a few minutes. I'm checking next to see about reserving a copy of that Everything is Predictable. You know, now that I'm thinking about it, I wonder if I can get a copy of that research paper also? Maybe a digital copy to my home computer for a few days or something like that. Please start that thread at your convenience but I'll need to read up on this subject to contribute what little I can. Hopefully it will have a lively participation.
-
Hello Ken. An interesting research paper came out several days ago. I've been really soaking my brain in it today. Much to think about. Intrinsic vs. extrinsic. https://www.pnas.org/doi/10.1073/pnas.2424725122 Historical and experimental evidence that inherent properties are overweighted in early scientific explanation Zachary Horne https://orcid.org/0000-0001-6629-2040 Zachary.Horne@ed.ac.uk, Mert Kobaş https://orcid.org/0000-0002-9669-9033, and Andrei Cimpian https://orcid.org/0000-0002-3553-6097Authors Info & Affiliations Edited by Timothy Wilson, University of Virginia, Charlottesville, VA; received December 2, 2024; accepted August 6, 2025 September 19, 2025 122 (38) e2424725122 https://doi.org/10.1073/pnas.2424725122 Significance "Some of the most significant achievements of human history have come about as a result of our scientific ingenuity. Thus, understanding scientific reasoning is a key goal for cognitive science. The present research uses a unique combination of experimental and historical data to advance this field of inquiry, revealing that basic cognitive processes underlying explanatory reasoning give rise to a systematic inherence bias among practicing scientists—a tendency to explain phenomena in terms of their inherent properties rather than external factors. This bias, which acts as a bottleneck to scientific discovery and the learning of new scientific concepts, appears to shape the trajectory of scientific theories throughout history." Abstract "Scientific explanation is one of the most sophisticated forms of human reasoning. Nevertheless, here we hypothesize that scientific explanation is susceptible to some of the same biases that influence everyday thinking—particularly during the initial stages of theory building, when scientists are first grappling with complex phenomena and are thus more likely to rely on explanatory “guesses.” Specifically, we investigated whether scientific explanation exhibits an inherence bias—a tendency to explain phenomena through inherent or intrinsic features rather than extrinsic factors such as context or relations. Consistent with this hypothesis, a comprehensive analysis of major explanatory transitions across the history of Western science revealed that initial scientific explanations systematically favored inherent properties, while subsequent explanations incorporated extrinsic factors more consistently. Seven experiments with lay participants (both adults and children; N 1,673) and two experiments with practicing scientists from top departments worldwide (N 275) provided converging evidence for this bias and identified the psychological mechanisms involved. When explaining unfamiliar phenomena, even leading scientists showed a robust tendency to overweight inherent properties and underweight extrinsic factors relative to established scientific understanding. This bias appears rooted in basic cognitive constraints on attention and memory that excessively narrow the space of hypotheses initially considered. These findings advance our understanding of both the psychology of explanation and the development of scientific knowledge, while suggesting specific ways to improve scientific training and education." I'm in need of a complete paper. here is an article about it. https://www.earth.com/news/centuries-of-errors-expose-a-recurring-human-bias-in-science/ Thank you for the welcoming. Your critiques are appreciated and acknowledged. Good to know you are still here. . . As in SF and not . . . . you know what I mean.
-
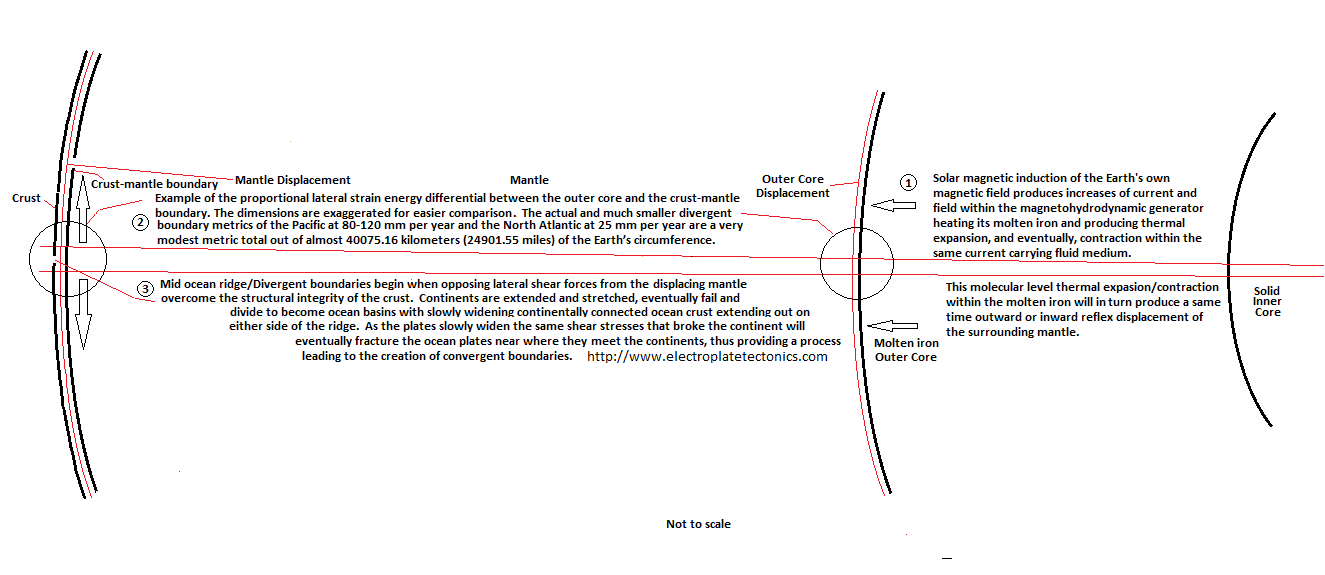
Hello all, it has been awhile. I came back to update a thread on whether the hypothesis I was presenting had been able to predict the climate in these intervening years since I first presented it here. But the two threads that I had in mind had both been archived. “This topic is now archived and is closed to further replies.” https://scienceforums.net/topic/78633-geological-activity-causing-climate-change-split-from-reasons-not-to-worry/ https://scienceforums.net/topic/75027-a-model-for-the-solar-magnetic-forcing-of-earths-climate-history/ They were both from 2013, and much has happened during these intervening years and I thought now would be a good time to see which model did a better job at predicting the observations (climate) that we all have been experiencing in real time. Contestant number 1 is the mainstream climate model that many consider persuasive to the observed climate warming of the last several years as being resultant of the contemporaneous and increasing anthropological green house gas emissions since the beginning of the industrial revolution. Contestant number 2 is my hypothesis model that posits the climate warming since the industrial revolution up through this most recent warming anomaly is the result of the same driver of earlier natural warming and cooling events seen in historical climate records. Some of these other examples are the Younger Dryas cold period, the 8.2 Kyr Event, Roman Warm Period, Medieval Warm Period and the Little Ice Age, etc. The hypothesis in question posits that solar magnetic energy flux can predict not only the timing, but also the intensity of the given climate sample period where both the temperature proxies and solar magnetic proxies can be compared and correlated. First up is Contestant number 1. https://earthobservatory.nasa.gov/images/153588/charting-the-exceptional-unexpected-heat-of-2023-and-2024#%3A~%3Atext%3DIn%202024%2C%20global%20temperatures%20for%2Cfor%20Space%20Studies%20%28GISS%29. "In 2024, global temperatures for June through August were the hottest on record, narrowly topping the same period in 2023. The exceptional heat extended throughout other seasons, too, with global temperatures breaking records for 15 straight months from June 2023 until August 2024, according to scientists from NASA’s Goddard Institute for Space Studies (GISS)." “In a commentary in Nature, Gavin Schmidt, the director of GISS, used words like “humbling” and “confounding” to explain just how far temperatures overshot expectations during that period.” “Warming in 2023 was head-and-shoulders above any other year, and 2024 will be as well,” Schmidt said. “I wish I knew why, but I don’t. We’re still in the process of assessing what happened and if we are seeing a shift in how the climate system operates.” “In September, the record was broken by an absolutely astonishing 0.5 degrees Celsius,” Schmidt said. “That has not happened before in the GISS record.” ""Major volcanic eruptions, such as El Chichón in 1982 and Pinatubo in 1991, have caused brief periods of global cooling in the past by lofting aerosols into the stratosphere. And research published in 2024 indicates the eruption in Tonga had a net cooling effect in 2022 and 2023. “If that’s the case, there’s even more warming in the system that needs to be explained,” Schmidt said."" “In late 2022, as he has done each year since 2016, Schmidt used a statistical model to project global temperatures for the coming year. La Niña—which cools sea surface temperatures in the tropical Pacific—was present for the first part of 2023 and should have taken the edge off global temperatures. Schmidt calculated that average 2023 global temperatures would reach about 1.22 degrees Celsius above the baseline, putting it in the top three or four warmest years, but that it would not be a record-breaking year. Scientists at the UK Met Office, Berkeley Earth, and Carbon Brief made similar assessments using a variety of methods.” Well, they were pretty thorough. “Scientists at the UK Met Office, Berkeley Earth, and Carbon Brief made similar assessments using a variety of methods.” https://www.nature.com/articles/d41586-024-00816-z Climate models can’t explain 2023’s huge heat anomaly — we could be in uncharted territory Taking into account all known factors, the planet warmed 0.2 °C more last year than climate scientists expected. More and better data are urgently needed. By Gavin Schmidt “When I took over as the director of NASA’s Goddard Institute for Space Studies, I inherited a project that tracks temperature changes since 1880. Using this trove of data, I’ve made climate predictions at the start of every year since 2016. It’s humbling, and a bit worrying, to admit that no year has confounded climate scientists’ predictive capabilities more than 2023 has.” “For the past nine months, mean land and sea surface temperatures have overshot previous records each month by up to 0.2 °C — a huge margin at the planetary scale. A general warming trend is expected because of rising greenhouse-gas emissions, but this sudden heat spike greatly exceeds predictions made by statistical climate models that rely on past observations. Many reasons for this discrepancy have been proposed but, as yet, no combination of them has been able to reconcile our theories with what has happened.” Alright, now contestant number 2. My hypothesis has been pretty straight forward and simple. The solar magnetic field is mutually inductively coupled to the Earth's magnetic field. This in turn leads to several climate forcing mechanisms. 1. The solar magnetic field being mutually inductively coupled to the Earth's magnetic field, and more importantly, its field generating components, allows for a long term variable strain energy derived thermal forcing at the crust mantle boundary and specifically mid ocean ridges and volcanically active thermal regions. And 2. In regards to the climate anomaly being referenced and considered by Gavin Schmidt above; a rather direct upper atmospheric magnetic field heating mechanism. So, what was the solar magnetic field doing while this thermal anomaly was perplexing Gavin Schmidt and the other researchers and their models? Here in the following research we can uncover what we are seeing in those solar magnetic energy level graphs that correlate to this warming anomaly. https://faculty-directory.dartmouth.edu/mukul-sharma Earth and Planetary Science Letters Volume 199, Issues 3–4, 10 June 2002, Pages 459-472 https://www.sciencedirect.com/science/article/abs/pii/S0012821X02005162 Variations in solar magnetic activity during the last 200 000 years: is there a Sun–climate connection? Mukul Sharma Introduction "The way the solar surface magnetic activity affects the Earth’s climate on short timescales (days through centuries) constitutes an area of active research with postulated mechanisms that include: (1) changes in solar luminosity as the Sun becomes magnetically more active, and (2) variations in solar activity leading to large changes in solar ultraviolet radiation that, in turn, affects the stratospheric ozone content, and modulated galactic cosmic rays influencing the cloud formation via inducing changes in the tropospheric ion production. Evidence linking solar activity to climate change during the last millennium has also accumulated on a 100-yr timescale. Friis-Christensen and Lassen report a close correspondence in the last 100 yr between average Northern Hemisphere temperatures and changes in the length of the solar magnetic cycle. An often-cited example is that of the Maunder Minimum (1645–1715 AD) corresponding to the Little Ice Age during which no sunspot activity was observed. Using the combined 14C and 10Be records, a solar activity minimum has been inferred for this period centered at 1690 AD. Other solar activity minima centered at 1060, 1320 (Wolf), 1500 (Spörer), and 1820 AD. Also, the solar activity is inferred to be high during the Medieval Warm Period (12th and 13th centuries). On the basis of variations observed in the 14C contents of tree rings and their growth, Suess and co-workers inferred that the solar activity varies with a 200-yr cycle, which also controls the climate. Stuiver and Braziunas investigated a 9600-yr-long high precision 14C record and found that the Sun is oscillating with a fundamental frequency of 1/420 yr−1 with the second and third harmonics corresponding to 218- and 143-yr periods, respectively. These workers suggest that there may be a Sun–climate relationship for the third harmonic. A recent paper concludes that surface winds and surface ocean hydrography in the sub-polar North Atlantic have been influenced by 1500-yr oscillations in solar activity through the entire Holocene. Does the solar activity also vary on a longer timescale? If so, what is its relationship to long-term climate change? In this paper I explore these two questions by estimating the relative variations in solar modulation of galactic cosmic rays (GCR), assuming that the modulation depends directly on the mean interplanetary magnetic field generated by solar surface magnetic activity." https://www.researchgate.net/publication/225891092_Climate_changes_associated_with_high-amplitude_Sq_geomagnetic_variations Climate changes associated with high-amplitude Sq geomagnetic variations October 2011 Acta Geophysica 59(5):1044-1056 DOI:10.2478/s11600-011-0029-x Taha Rabeh, National Research Institute of Astronomy and Geophysics João Carvalho, Laboratório Nacional de Energia e Geologia Ahmed Khalil, National Research Institute of Astronomy and Geophysics Abstract “When the solar irradiance propagates between the outer magnetospheric regions and the ionosphere, dynamic processes of the magnetosphere-ionosphere-thermosphere system are affected at the lower end of their paths by the interaction of radiation with the neutral troposphere. The main target of this work is to investigate the relationship between the diurnal magnetic field variations resulting from solar activities and the variation in the troposphere temperature. Meteorological and geomagnetic data acquired from different observatories located in Egypt, Portugal and Slovakia in a long-term and daily-term scales were analyzed. The long-term results show that there is a close relationship between the diurnal Sq magnetic field variations and the tropospheric temperature. The rate of temperature increase at mid-latitude areas is higher than at high-latitude. During the period of investigation, it is found that the troposphere temperature has increased by about 0.033 °C/year at Helwan, Egypt, 0.03 °C/year at Coimbra, Portugal, and 0.028 °C/year in Hurbanovo/Stará Lesná, Slovakia. The Sq geomagnetic variations depend on the intensity of the electric currents generated by the effect of solar radiation in the ionosphere.” SOLAR RADIATION AND GEOMAGNETIC FIELD "Reid (1987) used in his correlation the global mean value of sea surface temperature (SST) (see Fig. 1) for the period from 1860 to 1980. He shows a close relationship between the changing rate in the solar activities and the changing rate of the Earth’s tropospheric temperature. It can be noticed that the 11-year smoothed annual mean sunspot numbers (SSN) increased from about 45 during the year 1860 to about 80 for the year 1985, while the sea surface temperature increased by about 0.45 °C during the specified period. The correlation shows matching between the maxima and minima of the sea surface temperatures and the mean values of the sunspot number CONCLUSIONS "An analysis of the relationship between the magnetic field and the tropospheric temperature changes has been conducted using the horizontal magnetic component, H, and tropospheric temperature, °C, as well as Sq magnetic field. The correlation between H and °C for the 100 year recorded data proves their close relationship in terms of 11-year solar cycle and the diurnal variations (see Table 1). This is apparent from the correlation between the °C and aa-index and sunspot numbers. Obviously the magnetic field is produced from the electric current in the ionosphere deduced from the solar radiation/solar plasma. The existence of a close relationship of solar activity with the lower troposphere is due to the close distance between the location of the ionosphere and the lower troposphere where the coupling process of thermosphere-ionosphere-mesosphere-stratosphere exists. The mechanism of the thermal heating in the troposphere by cosmic rays, storms and flares induces electric currents where a permanent layer of heavy ion-clusters is produced. The currents in this layer control the electric fields and hence the magnetic field. The heating occurs due to this process (Baker 2000). This process has a direct effect on the troposphere temperature. The rate of the temperature increase at mid-latitude areas is higher than that at high-latitude areas. The geomagnetic variations reflect the fact that an additional magnetic field, ∆h, depends on the intensity of the electric current, I, deduced from the solar radiation. Hence, the Sq magnetic field variations are mainly affected by the intensity of the solar radiation and therefore are correlated with the changes in the tropospheric temperature." A new paper has been published in regards to these phenomena; https://agupubs.onlinelibrary.wiley.com/doi/10.1029/2024JA033493 Quasi-Periodic Pulsations in Ionospheric TEC Synchronized With Solar Flare EUV Emission Aisling N. O’Hare, Susanna Bekker, Laura A. Hayes, Ryan O. Milligan First published: 28 April 2025 https://doi.org/10.1029/2024JA033493 Abstract "The extreme ultraviolet (EUV) and X-ray radiation emitted during solar flares has been shown to significantly increase the electron density of the Earth's ionosphere. During flares, quasi-periodic pulsations in X-ray flux originating in the corona have previously been linked to subsequent pulsations in the Earth's ionospheric D-region. Similar pulsations have been detected in chromospheric EUV emission, although their impact on the Earth's ionosphere has not previously been investigated. Here, for the first time, synchronous pulsations were detected in solar EUV emission and ionospheric Total Electron Content (TEC) measurements. Using wavelet and periodogram analysis, we detect QPPs with approximately 85 s periods in chromospheric EUV emission lines (He ii 304 Å, C iii 977 Å, and H i 972 Å) from the Solar Dynamics Observatory Extreme Ultraviolet Variability Experiment during the impulsive phase of an X5.4 flare on 7 March 2012. These lines contribute to ionization in the ionospheric E- and F-regions, resulting in subsequent variations of electron density with the same periodicity, which was detected in TEC measurements. This work demonstrates that the Earth's ionosphere is responsive to fine-scale fluctuations in EUV emission during flares, with a time delay of approximately 30 s found. These findings may have applications in atmospheric modeling and solar-terrestrial studies, including the calculation of ionospheric recombination rates." 1 Introduction . . . . ."The mechanisms responsible for driving QPPs in solar flares remain a focus of intensive theoretical studies. For comprehensive reviews of such models, see Zimovets et al. (2021), McLaughlin et al. (2018), and Van Doorsselaere et al. (2016). These models explore various mechanisms, including the modulation of plasma by MHD (magnetohydrodynamic) oscillations in flaring loops, periodic energy release driven by MHD modes, and intrinsically periodic energy release processes. Some observational studies suggest that this periodic behavior may result from the quasi-periodic injection of non-thermal electrons down into the chromosphere by episodic magnetic reconnection (Brosius et al., 2016; Collier et al., 2024)." 5 Conclusion "This study presents the first recorded instance of synchronized pulsations in EUV flare emissions and ionospheric TEC, suggesting a highly sensitive coupling between oscillations in solar EUV radiation and the Earth's ionosphere on very short timescales. The selected EUV emission lines (He ii 304 Å, C iii 977 Å, and H i 972 Å) appear to significantly drive oscillatory behavior in TEC measurements, indicating a direct influence on ionospheric variability." This next paper involves a solar wind phenomena occurring with Jupiter. But, .An associated electric current system delivering Joule heating may instead explain the hot feature https://agupubs.onlinelibrary.wiley.com/doi/10.1029/2024GL113751 Sub-Auroral Heating at Jupiter Following a Solar Wind Compression James O’Donoghue, L. Moore, H. Melin, T. Stallard, W. S. Kurth, M. Owens, T. Bhakyapaibul, C. Tao, J. E. P. Connerney, K. L. Knowles, H. Kita, K. Roberts, P. I. Tiranti, O. Agiwal, R. Johnson, R. Wang, E. Thomas, G. Murakami First published: 03 April 2025 https://doi.org/10.1029/2024GL113751 Abstract "Jupiter's polar aurorae deliver significant heating at the poles, thought to spread across the planet through atmospheric winds. Additionally, ground-based Keck observations have revealed a large-scale high-temperature region, spatially distinct from the aurorae. Here, we investigate the origins and characteristics of the feature using Keck data, in-situ Juno spacecraft measurements, and solar wind modeling. Juno exited the magnetosphere on approach to Jupiter, coinciding with modeled high-speed solar wind impact that compressed the magnetosphere. This hot feature may be dynamic, transported equatorward by winds following auroral activity enhancements from magnetospheric compression akin to a large-scale traveling ionospheric disturbance on Earth, or driven by the inner magnetosphere particle precipitation. Exploring the dynamic case, we calculated equatorward velocities ranging from 0.46 to 2.02 km s−1, similar to those seen at Earth. Our study underscores the importance of the solar wind at all planets, exemplified by its ability to alter Jupiter's upper-atmospheric energy balance globally." 3 Results and Discussion " . . . . .An associated electric current system delivering Joule heating may instead explain the hot feature, akin to the aurorae but temporary, as it has only been observed on one night to date. This current system, or the previously discussed preferentially high-altitude precipitation, could be sustained by Jupiter's ionospheric dynamo through complex vertical and horizontal drifts within the ionosphere (Kurth et al., 2025). Figure 2c illustrates where the feature maps to in Jupiter's equatorial plane via magnetic field lines, suggesting either that the magnetospheric source region (if it is indeed the source) is broad or moves rapidly, on the order of tens of km s−1. The lack of a well-defined theoretical source region, coupled with the fact that the hot feature spans half the planet without interruption, leads us to consider a dynamic explanation in which hot atmosphere has traveled from the aurorae to this position. It is possible that the hot feature we see on Jupiter is essentially a manifestation of a large-scale traveling ionospheric disturbance seen on Earth." Well, now we can wait and see in the next few years what is going to happen. My hypothesis will assume the solar magnetic energy output level will continue to predict temperature while I assume from reading the mainstream studies they believe it has crossed a boundary of some type and will not return to lower temperature levels. The solar magnetic will however most likely return to lower levels and my model would assume temperature will also in proportion to the reduction. For a little bit of additional background to my confidence in this model I would submit the following; USGS solar magnetic proxy graph overlaid with the boundaries of the Medieval Warm Period and the Little Ice Age. The solar magnetic and climate synchronicity is not just limited to the Medieval Warm Period or The Little Ice Age and the subsequent "extraordinary" warming period that followed up to the present. The solar magnetic energy levels that is recorded in tree ring 14C samples for the last 1100 years are bolstered by even greater data content from ice cores that shows an additional 11,400 years of solar magnetic and climate coupling. https://www.researchgate.net/publication/8207374_Unusual_activity_of_the_Sun_during_recent_decades_compared_to_the_previous_11000_years Unusual activity of the Sun during recent decades compared to the previous 11,000 years Nature, Vol. 431, No. 7012, pp. 1084 - 1087, 28 October 2004. S.K. Solanki1, I. G. Usoskin2, B. Kromer3, M. Schüssler1, and J. Beer4 1 Max-Planck-Institut für Sonnensystemforschung (formerly the Max-Planck- Institut für Aeronomie), 37191 Katlenburg-Lindau, Germany 2 Sodankylä Geophysical Observatory (Oulu unit), University of Oulu, 90014 Oulu, Finland 3 Heidelberger Akademie der Wissenschaften, Institut für Umweltphysik, Neuenheimer Feld 229, 69120 Heidelberg, Germany 4 Department of Surface Waters, EAWAG, 8600 Dübendorf, Switzerland "According to our reconstruction, the level of solar activity during the past 70 years is exceptional, and the previous period of equally high activity occurred more than 8,000 years ago. We find that during the past 11,400 years the Sun spent only of the order of 10% of the time at a similarly high level of magnetic activity and almost all of the earlier high-activity periods were shorter than the present episode. Now compare the graph above illustrating the current and exceptional solar magnetic field generator energy peak of the prior 10,000 years to the one below illustrating the current planetary magnetic field generator's exceptional energy level peak of the last 800,000 years. These two graphs illustrate quite accurately the mutual inductive coupling of the Sun's and the Earth's magnetic fields and their generators. The solar magnetic energy levels that is recorded in tree ring 14C samples for the last 1100 years are bolstered by even greater data content from ice cores that shows an additional 11,400 years of solar magnetic and climate coupling. Graph A above http://www.ncdc.noaa.gov/paleo/pubs/alley2000/alley2000.html "This figure, adapted from the NRC (2002) report Abrupt Climate Change: Inevitable Surprises, comes from data in Alley (2000) and Cuffey and Clow (1997). It shows the clear, abrupt increases in temperature in the Greenland Ice Sheet Project 2 (GISP2) record at the end of the last glacial period and at the end of the Younger Dryas. The cooling as temperatures returned to the glacial conditions of the Younger Dryas takes place over a longer period in a step-wise fashion." Graph B The data from Alley was used to make this graph B (above) by Giorgiogp2, who has no connection to this author or this paper and was provided through Wikipedia Creative Commons. It was compiled from Data source: http://www.ncdc.noaa.gov/paleo/pubs/alley2000/alley2000.html, I took this graph and reversed it to have the most recent events on the right so it could then be more easily compared to the solar magnetic 14C content data in graph C. Graph D1 and D2 at left. I then plotted the points of both the solar magnetic flux and temperature in synchronized chronological order between the two graphs, now referred as D1 and D2 above. What stands out first is the extremely high solar magnetic energy at 1 to the left on graph D2, the energy level is higher than even the unusually high solar magnetic level mentioned above and shown as the red vertical line extending above and to the right of Pt. 23. Pt. 1 on the far left side of the graph occurred at the end of the Younger Dryas cold period that saw a rapid return to glacial conditions in the higher latitudes of the Northern Hemisphere between 12.9–11.5 ka BP. The high solar magnetic energy of Pt. 1 of D2 correlates to when the temperature climbed out of the Younger Dryas cold period at Pt. 1 of D1. Let’s look at graph A (above) again for additional clarity. As you can see the extreme solar magnetic energy of point 1 occurred simultaneously with the temperature increase as the climate climbed out of the Younger Dryas, a remarkable correlation of two extreme events. It should also be noted this rise is as precipitous as the most recent solar magnetic energy level (Red) seen in graph C below. To have these two extreme warming events coincide with proportionate solar magnetic flux is beyond what could be considered coincidence; add to this the lesser but still concurrent events between these two extremes and this evidence should convince even the most reluctant observer that the current model is lacking in its abilities to accurately portray the observable world. The rarity of this high magnetic energy is clear; "We find that during the past 11,400 years the Sun spent only of the order of 10% of the time at a similarly high level of magnetic activity and almost all of the earlier high-activity periods were shorter than the present episode." The 8.2 Kyr Event at Pt. 3 is very easily seen in graph D2, the energy level decrease from the graphs 4th highest peak of Pt.2 is clearly shown. http://en.wikipedia.org/wiki/8.2_kiloyear_event "The 8.2 kiloyear event was a sudden decrease in global temperatures . . . .and lasted for the next two to four centuries. Milder than the Younger Dryas cold spell that preceded it, but more severe than the Little Ice Age that would follow, the 8.2 kiloyear cooling was a significant exception to general trends of the Holocene climatic optimum. During the event, atmospheric methane concentration decreased by 80 ppb or 15% emission reduction by cooling and drying at a hemispheric scale." What is important to understand is the spacing between the vertical lines such as is seen at Pt.1 and then again at Pt.3 and Pt.16 (red circles) shows a rather unusually large gap indicating an extended period of low magnetic energy. This would allow the dissipation of planetary thermal content and a substantial drop in average temperatures as the cooling ocean allows the atmospheric content to move down also. Other pronounce points such as 4-5 and 10-11 allowed enough cooling (gaps between lines) to show as such on graph D1. The next few years should be very interesting to see what the changes in the solar magnetic energy output will have on the climate.
-
arc changed their profile photo
-
I've found British documentaries on YouTube and I don't think I'll ever get through them all. It's wonderful! There is one series called "Battle Stations" that I'm going through right now, in the past months I've watched docs on Geology and its early founders, Ships, Planes, Airships, WW I and II Tanks and Tank Battles, Great English machines, ect. It is nice to be able to watch what you want when you want to. To all the Brits here thanks for all the great historical content that your citizens obviously care so much about. A real historical treasure chest to share with the world.
-
Just goes to show, not all sheep behave like . . . . . . well . . .sheep
-
I think they appear deceptively simple. But all of the ball's contact points must be directly inline from one end to the other, from first to the last. Even unnoticeable variation in contact points would produce deflection, so energy would be spent inducing rotation in the ball that then would be transferred to the other balls and even to the strings as they resist the errant movement being transferred down the line. All of the best examples I've seen use metal that resists the dynamics of the swinging mass, any unnoticeable movement in the frame would dampen the kinetic energy. As would any variation in specifications between components that should ideally be identical.
-
I have a reasonable suspicion this is how Kim Jong-un's bodyguards screw with him.
-
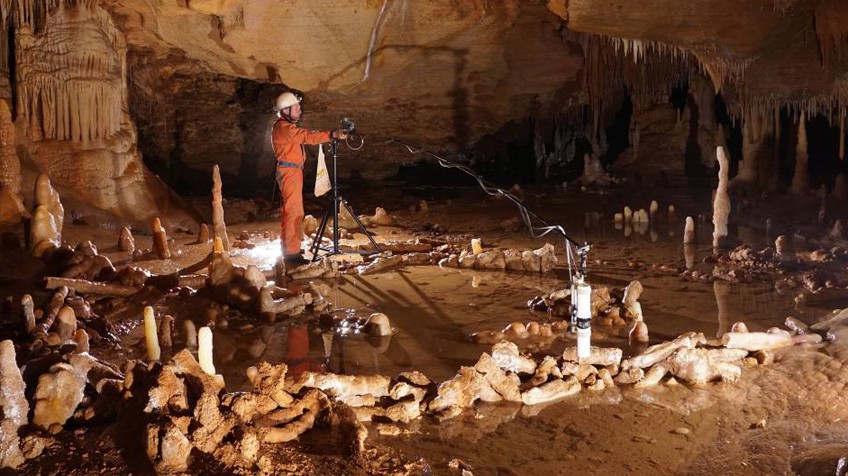
Why must we conclude that if this was a Neanderthal construct, or for that matter, built by any others, that it must have been a successful design? The more recent human history (you know, the one we have record of) shows a vast array of trial and error as modus operandi. Why would we assume the Neanderthal would operate any different? That image to me shows a campsite far enough within a cave to ward off the deepest cold of that glacial period. They constructed a campfire to stay warm and slept and ate near their fires. Past experience in other campsites inside and outside of caves showed them that naturally positioned rocks at an appreciable distance around the fire became warmer due to the fire and made occupying, and more importantly, sleeping in the area more enjoyable. This would likely lead them to build such a structure you see in the image. The height is just enough to block the draft that comes in the cave entrance and travels along the floor where they would have lain to sleep. The materials would radiate the expected heat that the other campsite rocks had done in the past while the clay or dirt compacted against it would block that cold air that is drawn inward along the floor by the fire and keep it from going through the openings between the materials of the constructed wall. All was done and worked well until the water started to build up behind the wall, as can be seen in the image. Alas, success meets with failure once again.

-
Back when I was a kid we had some ponies and later a horse, the flies would always go for the animals eyes, nose and mouth looking for any moisture they could find. http://insects.about.com/od/HouseholdPests/f/Do-Flies-Really-Vomit-And-Poop-When-They-Land-On-You.htm By Debbie Hadley Insects Expert . . . . "Unfortunately for the house fly, it is not equipped to chew solid foods. Most insects that feed on solid food – beetles, for example – have chewing mouthparts, with which they can properly masticate their meals into tiny, digestible bits. House flies were instead blessed with sponge-like tongues. Only in flies, we call their tongues labella (the singular is labellum, but the fly has a matched pair)." "House flies "taste" with their feet . . . . . When a house fly comes upon something that seems like it might be yummy (keep in mind that dog poop is the kind of thing house flies find yummy), it will reflexively stick out its labella and press it against the potential food item to investigate. Liquids can be slurped up without much effort. Inside the house fly's head is a structure called a cibarial pump (or food pump), which generates a suction to draw the liquid up through channels in the mouthparts (called pseudotrachea). So how does the house fly make a meal out of meat, or any other solid food (like dog poop)? It uses those same mouthparts to liquefy the entrée." "The house fly dabs the tasty morsel with digestive enzymes by bringing up a little regurgitated food and saliva. The enzymes begin breaking down the solid food, gradually turning it into a slurry the house fly can then lap up. Meat milkshake, anyone?" "Now, think about the last time you had a stomach flu. Anytime you vomit repeatedly, you run the risk of dehydration, so you have to drink a lot of fluids to replace the ones you lost. Flies are no different. This liquid diet means flies require a lot of water. And when you drink a lot of water…well, let's just say what goes in, must come out, right? So flies do a lot of defecating, too." The CO2 is likely what allows the flies to locate the animals which then provide the needed moisture through their eyes, nose and mouth openings. With their hydration needs satisfied they can then dine, mate and then lay their eggs on the surrounding feces that these one-stop fly supply emporiums provide. And when they cannot find a horse or elephant or lion they will settle for us.


-
When I was about 6 years old my folks bought an old farm house with a corral where the previous owners kept their two horses and two Shetland ponies. They took their horses with them, and with what seemed as a generous gift, gave me and my older sister the ponies. My sister was the industry standard for the mean older sister. Within a few hours my pony had knocked her face down in the mud and poo with a hard nudge of his nose, he then held her there with his right hoof while giving her a hard bite on the left ear. At that moment I thought ponies were the greatest thing I had ever seen!
-
I don't even want to know what the headlight looks like.
-
Man! You really nailed that punch line!Free to a good home. Has eaten so many mice its starting to look like one.


Important Information
We have placed cookies on your device to help make this website better. You can adjust your cookie settings, otherwise we'll assume you're okay to continue.