
arc
-
Posts
978 -
Joined
-
Last visited
Content Type
Profiles
Forums
Events
Everything posted by arc
-
Are you referring to the first page of Mantle plumes ? - http://www.mantleplumes.org/ The contributors are scientists from both sides of the debate. Dr. Anderson is part of the establishment. I don't follow your reasoning. You have miscategorized Dr. Anderson and his contributions to that site. As for "going on the road", I have two sites on weebly and a SFN blog. I'm here because it strengthens my model to debate it. The feining and avoiding materials like that of post #275 are apparently par for the course though. There is, to say, a lot of time spent by certain individuals to concentrate on what they perceive as low hanging fruit, not willing to risk attacking the material in posts like #275.
-
You are probably right. It seems to eventually develop in some threads where there is a large disagreement between individuals. I have a feeling that has been slowly developing for over a year, that no matter how good the evidence I post, it will be ignored. Post 275 is a good example. No comment? Too much for someone to deal with? They take the "pretend it doesn't exist" tactic and keep banging away at the tattered edges where perceived weaknesses are. Thats OK for awhile but there is some "pretending to not see the connection" going on here. That post above, #311 by Billiards is a cut and run. He didn't like me showing in the preceding post how weak his standard model is. The long list of inventions to fix it's problems. And again, he didn't understand my model so he didn't like the detailed answer I gave; "So you can't imagine the mantle could sustain the strain energy response's for millions of years as a sawtooth incline, huh. That the fraction of a degree rise over millions of years could contain short periods of reduced or increased energy. The "tooth" containing frequencies or pulse cycles of strain energy releases or reductions of them. The spacing between them controlling the variable content amounts. A Glacial would be widely spaced intervals and an interglacial would be closely spaced having the higher thermal content at the crust/mantle boundary. This is a solar magnetic phenomena containing electromagnetic frequencies. The closer together they are the more heat will flow into the ocean causing the climate temperature to increase slightly. The earthquake periodicities would also increase as the largest plates telegraph the mantle's more frequent strain energy cycle. Like is happening now. . And then, as their timing slows the heat content to the ocean would decrease causing cooling of the climate while the earthquakes decrease. The holocene's Bond and Dansgaard-Oeschger events of the last glacial occurred at quasi 1470 year periodicities and would be a result of these frequencies along with the Little Ice Age, the 8.2 kiloyear event, and the Younger Dryas." Another post ignored with a dismissive comment and a quick exit. If you can't deal with the answers don't ask the questions. And looking like you are too afraid to tackle posts like #275 doesn't help. Do you know about the author of that link? He is a major contributor to that site. http://www.seismolab.caltech.edu/anderson_d.html Don L. Anderson EMERITUS PROFESSOR Eleanor and John R. McMillan Professor of Geophysics, Emeritus Ph.D., 1963-2002 California Institute of Technology Seismological Laboratory 1200 E. California Blvd., MS 252-21 So. Mudd Building, Rm 263A Pasadena, CA 91125 Email: dla@gps.caltech.edu Website: http://www.gps.caltech.edu/~dla Research Interpretation of deep Earth seismic data, including tomography, to derive models for the composition, physical state and evolution of the Earth's interior; derivation of global geodynamic models; synthesis of geochemical, geophysical and geodynamic data; interactions of lithosphere and asthenosphere. Past Director, Seismological Laboratory, 1967-1989 Acme, believe me, Billiards knows the weight of this man's words. Dr. Anderson is not one to be disregarded. And that site is for discourse regarding the related phenomena. It is filled with material by topnotch scientists.
-
And you do understand that mantle convection and mantle plumes are completely hypothetical inventions with absolutely no verifiable evidence that they exist. So you can modify them anyway you want within reasonable parameters because you are not burdened by the pesky demands of having to have or maintain verifiable observations. When convection could not produce the needed answers they invented plumes. Then plumes lead to . . . . . . http://www.mantleplumes.org/Zombie.html "Rationalizations of the observed characteristics of hypothetical plumes have generated continuously changing predictions regarding fixity, hot-spot motion, age progressions of island chains, heatflow, style of mantle convection, uplift prior to magmatism, temperatures of magmas, and geochemistry. These predictions are rarely successful, so the concepts have been modified to allow as many exceptions, and as many kinds of plumes, as there are "hot spots". The guiding principles are non-physical. The products of plumes are whatever is observed where plumes are postulated. Amendments to the fixed "hot spot" hypothesis now include mantle winds, polar wander, mantle roll, lithosphere drift, lateral flow, magma tunnels, group motions of "hot spots", plume head decapitation and superplumes. Mantle winds are used to explain non-fixity of "hot spots". “Fixed hot spots" may be large regions or long "hot lines" within which volcanoes can pop up anywhere and in any sequence. Plumes are postulated to feed volcanoes thousands of kilometers distant, and they no longer need fit Euler geometry or global reference frames. If age progressions are non-uniform, new co-linear plumes are added. Most “plume tracks” are missing a “plume head”, and most “plume heads” are missing a track. The lack of evidence for “plume heads”, “plume tracks”, high heatflow and precursory uplift is ignored or rationalized. Evidence for the uplift predicted to precede the Siberian flood basalt is assumed to be hidden beneath the west Siberian lowlands, whereas that for Hawaii is assumed to have been subducted. Findings that defy such ad hoc adjustments became official paradoxes: the Lead Paradox, the Helium Paradox, and the Heat Flow Paradox. New observations are labeled surprising, unexpected, counter-intuitive or anomalous." It's all hypothetical. Adding one more preoccupied Geoscientist who would be unwilling to invest the time to understand this idea would not be any more productive than the current situation. I'm sorry but I'm thinking that you're a little too biased to really give fair analysis. You just go in blasting away and as I noted above, it appears you didn't even know enough about the model to evaluate accurately. Take another look at that link above and that quote. That is a mess of fixes to keep convection and plumes viable, and then add to that the Carlo Doglioni critique. Its hard for me to take your criticism with any gravity. You don't seem concerned at all about any of the material showing how much the standard model is and has been in, as you say - "cloud cuckoo land." . You appear to have bought into it pretty deeply and give it a free pass. You still have not dealt with the 14C, climate, and earthquake evidence I have posted. On page 14 post #275 is material that no one has tried to challenge. You and everyone else have avoided it and ignored all my attempts to prompt and even provoke someone to challenge it. iNow challenge; "Can you demonstrate there has been a significant shift in tectonic dynamics since the industrial age, a shift that could account for the warming trend we're seeing and that is somehow different than shifts that have taken place through the last several thousand years?" And I demonstrated exactly that word for word. Any comment? Challenge? I didn't think so. So you can't imagine the mantle could sustain the strain energy response's for millions of years as a sawtooth incline, huh. That the fraction of a degree rise over millions of years could contain short periods of reduced or increased energy. The "tooth" containing frequencies or pulse cycles of strain energy releases or reductions of them. The spacing between them controlling the variable content amounts. A Glacial would be widely spaced intervals and an interglacial would be closely spaced having the higher thermal content at the crust/mantle boundary. This is a solar magnetic phenomena containing electromagnetic frequencies. The closer together they are the more heat will flow into the ocean causing the climate temperature to increase slightly. The earthquake periodicities would also increase as the largest plates telegraph the mantle's more frequent strain energy cycle. Like is happening now. . And then, as their timing slows the heat content to the ocean would decrease causing cooling of the climate while the earthquakes decrease. The holocene's Bond and Dansgaard-Oeschger events of the last glacial occurred at quasi 1470 year periodicities and would be a result of these frequencies along with the Little Ice Age, the 8.2 kiloyear event, and the Younger Dryas. But through this process the average content would increase or decrease with the solar magnetic/ planetary magnetic record previously discussed. "I admire your enthusiasm, but you are not doing science. I'm sorry. But it is true. You are not a scientist as you yourself say, so I do not see this as a weakness in you. It is a great strength that you have the imagination to do this. Your weakness is that you really believe you are doing science. Please, take the time to learn the science from the experts, challenge all you like but listen. Develop your idea, and develop it scientifically. Try to prove yourself wrong, listen to criticisms, build. Who knows, maybe this idea doesn't work, but if you keep challenging yourself, you might find yourself publishing something RELEVANT in a bonafide scientific journal one day." And you may not notice that you have been co opted to see things in a certain way. You were trained by someone who was trained by someone else. There was a process that required and still requires you to do things a certain way, you were told what was important and what was not. There has been pre programming in the way you think and do science since your early education. But you do not see this confirmation bias, it is how people everywhere operate. Scientists are not immune to its influence. If this model didn't have all of the predictions of observations I would not be here because I would know the model was not any better than what is already out there. I'm here because it does explain phenomena, you might not like it or agree with it but that's life in a free market of ideas.

-
Hi Billiards, long time no see. Hey, I was kind of hoping you would have used that time away to see if you could come up with even one prediction of observation that would even remotely resemble the observable natural world. You know, like; "This mantle plume did this and it made this oceanic plate do that" . . . . . or . . . "This decapitated plume head is causing this to move because we can see right here in this data it is increasing and going to do this because there's no other explanation" . . . . . . But we both know you can't make any predictions of observations with YOUR MODEL because . . . . .Drum roll please! . . . . . . . . . http://www.dst.uniro...antle_Dynamics_ "At the moment there is no way to link mantle dynamics and plate kinematics at the surface". . . . . . . . "In other words, mantle convection alone seems not able to generate plate tectonics." Damn, I bet you love reading that! So its kinda funny you have such an interest in knocking someone else's model. Hmm . . . . . . This isn't hypothesis envy is it? You and I and anyone who reads that link up there knows your model can't do crap, you have no predictions of observations to show for how many years you been doing whatever it is you do. So it kind of looks like you came over here to kick someone else's work out of spite. Did I say 1 degree? I don't recall ever saying 1 degree. This is the my opening post for this thread. arc Posted 18 March 2013 - 09:29 PM . . . . So I started with a simple model, just a divergent plate boundary, a plate and a convergent boundary (trench). The cycle begins with a small thermal increase in the molten iron core from increased current due to induction from the strengthening of the Sun's magnetic field.. . . . . . Nope, no 1 degree there. This is my second post of this thread. arc Posted 19 March 2013 - 10:09 PM Lets imagine that there is a small current/temperature variable over millions of years in the Earth's magnetohydrodynamic field generator ( that could and probably would also be expected in the current standard model I think) and it slowly raises the outer core's temperature a fraction of a degree over those millions of years. A fraction of a degree over millions of years. I believe almost everyone would expect the liquid outer core to thermally expand a proportionate amount to the degree of temperature rise. Well look at that! No 1 degree there either! I do say a fraction of a degree though. But its spread out over millions of years. I'm not a scientist but I know there's a big difference between one degree right now and a undefined fraction of 1/100 or is it 1/1000, or whatever it is when it is finally defined, over millions of years. So, are you just trying to mislead everyone as to what I have said, or is it you have just not taken the time to learn anything about what you are criticizing? You know this is not an easy thing to do, to come up with an original idea that could be a scientific breakthrough. You have to be a little loose to start with and then tighten up the concept as you learn the boundaries of the phenomena you are dealing with. Kind of like convection theory computer simulations; http://www.mantleplumes.org/Convection.html "Materials usually expand when heated. This causes them to rise when embedded in compositionally similar material. Pressure drives atoms closer together and suppresses the ability of high temperatures to create buoyancy. This is unimportant in the laboratory but it also means that laboratory simulations of mantle convection, including the injection experiments used to generate plumes, are not relevant to the mantle. Unfortunately, computer simulations are generally used to confirm the laboratory results and, when applied to the mantle, also ignore the effects of pressure on material properties. In fact, the effects of temperature are also generally ignored except the effect of temperature on density. This is called the Boussinesq approximation. This works fine in the laboratory, but does not apply to the mantle." Hmm. . . Looks like you guys are a little loose with the parameters. Wouldn't you say? Again, are you being dishonest or criticizing something you don't bother to understand? This is what I have always said: Again, are you being dishonest or just criticizing something you don't bother to understand? The thermal content that is seen in this graph as the Medieval Warm Period and the current warming since the Little Ice Age is made at the crust/mantle boundary by strain energy as the mantle is displaced, it does not migrate or convect from the core. http://solidmechanics.org/text/Chapter4_3/Chapter4_3.htm "A representative spherically symmetric problem is illustrated in the picture. We consider a hollow, spherical solid, which is subjected to spherically symmetric loading (i.e. internal body forces, as well as tractions or displacements applied to the surface, are independent of and , and act in the radial direction only)". Again, it's made under the crust, under the oceanic plate where it can pass into the ocean at divergent plate boundaries and hydrothermal vents. What I think would be fair is you guys, Acme, Billiards, iNow, start coming up with alternate explanations for the very accurate observation that this model makes. Really, it's that simple. iNow Posted 14 June 2014 - 05:32 AM "Just because there were different causes of climate change in the geological past doesn't mean that human activity cannot be the primary cause today. Your basic logic above is inherently flawed." Really! How about you explain why this model can predict the solar magnetic increase proportional to the climate warming since The Little Ice Age. And can further predict why and how the Pacific plate's proportionally larger plate movement is causing simultaneous earthquakes, in proportionally increasing numbers, simultaneously with the solar magnetic and climate values. You're just throwing rocks at something you won't even attempt to understand, and further, ignoring its ability to accurately predict surface geology and climate history. Until you can do that you guys are just blowing smoke. Quit babbling and come up with some answers! Seriously! Put up or shut up!

-
Sorry about that, all that extra stuff at the beginning of that post shouldn't have been there. Came along somehow from copy and pasting that old posting. I thought I checked it before going off to bed. Hmmm . . . I've had little sleep these last couple of days . . . . .There all gone now, well gotta go to work.
-
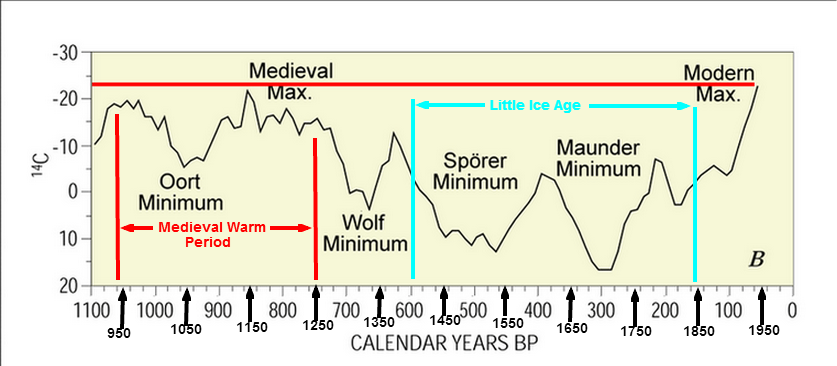
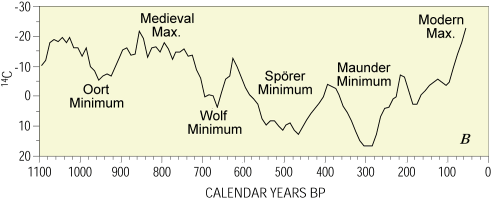
A Model for the Solar Magnetic Forcing of Earth's Climate History?Started by arc, May 21, 2013 arc Posted 21 May 2013 - 11:48 PM Quote Ophiolite Posted 23 May 2013 - 03:40 AM Thank you. I now feel encouraged to read at least some of your detail. ------------------------------------------------------------------------------------------------------------------------------------------------------------------ OK, here you go. Planetary Thermal Mechanism Abstract The Earth’s surface tells the story of its past. Austrian Edward Suess (1831-1914) and American James Dwight Dana (1813-1895) both independently observed mountain structures as the result of contraction. Other observers could clearly see the surface of the Earth had also been stretched out, breaking the crust into series of fractures that would weather through millennia into Basin and Range topography. The mechanics to create such structures if given over to a “simplest is most likely” philosophy would be to simply slowly and minutely inflate and deflate the mantle, the crust would then break at its weakest points and separate, allowing the magma underneath to slowly fill the gap as the plates separated. The Basin and Range Area of the southwest U.S. looks to have been caused by this scenario due to the fact that the area had been for millions of years overrunning and subducting the eastern edge of the Pacific Oceanic Plate. The Pacific’s western edge was held by the Marianna Trench and would impart the needed traction to pull the Basin and Range into existence during a period of outward mantle displacement. To allow this very simple idea to work a viable mechanism needs to be defined. The simplest I can imagine is thermal expansion. Because the magnetic field generator is an electro-mechanical driven mechanism it would already seem likely it could have such an effect on the overlaying planetary structures. To start, the model must show a variation in the current and field of the Earth’s magnetic field generator. This would be indicated by a change in field strength. http://science.nasa...._magneticfield/ A supercomputer model showing flow patterns in Earth's liquid core. Dr. Gary A. Glatzmaier - Los Alamos National Laboratory - U.S. Department of Energy. This article states that globally the magnetic field has weakened 10% since the 19th century. And according to Dr. Glatzmaier; "The field is increasing or decreasing all the time," "We know this from studies of the paleomagnetic record." According to the article; Earth’s present-day magnetic field is, in fact, much stronger than normal. The dipole moment, a measure of the intensity of the magnetic field, is now 8 × 10²² amps × m2. That's twice the million-year average of 4× 10²² amps × m2. Second, I would need to show that a larger magnetic field and generator could induce current and field into a smaller planetary type field. http://www.igpp.ucla...CRUS1572507.pdf Magnetometer data from Galileo’s multiple flybys of Ganymede provide significant, but not unambiguous, evidence that the moon, like its neighboring satellites Europa and Callisto, responds inductively to Jupiter’s time-varying magnetic field. With this credible example I will now need to show a direct link between the Sun’s magnetic field and the Earth’s field and its generator. Gerard C. Bond showed a correlation between 14C content in tree rings, which is a proxy measurement of the Sun's level of electromagnetic activity, and the 1500 year cycle of ice buildup in the N. Atlantic. http://www.ncdc.noaa...clisci10kb.html "Gerard C. Bond, a researcher at the Lamont Doherty Earth Observatory has suggested that the ~1,500 year cycle of ice-buildup in the North Atlantic is related to solar cycles; when the sun is at its most energetic, the Earth’s magnetic field is strengthened, blocking more cosmic rays, which are a type of radiation coming in from deep space. Certain isotopes, such as carbon-14, are formed when cosmic rays hit plants and can be measured in ancient tree rings because they cause the formation of carbon-14. High levels of carbon-14 suggests an inactive sun. In his research Bond noted that increases in icebergs and drift ice occurred at the same times as the increase in carbon-14, indicating the sun was weaker at such times." This is pretty clear that there is reasonable evidence to suspect a 1,500 year cycle correlation between solar magnetic flux and inductive coupling of the Earth's magnetic field generator and that of climate variability. Then there are these graphs that show solar magnetic field proxy measurements of 14C content that track perfectly through the climate variation of the last 1100 years, right through periods such as the medieval warm period and the little ice age. Solar magnetic flux is the only mechanism controlling the 14C content and timing. The 10 million dollar question is why does this content follow very accurately the climate history of the last 1100 years, coincidence? Image below courtesy of USGS http://pubs.usgs.gov.../fs-0095-00.pdf Image below modified by this author. As you can see this is correlated very convincingly. On the right side of the graph the line moves up out of the little ice age, again this is not temperature shown here it is 14C content in tree ring samples indicating magnetic field strength. (The 14C content is inverted) It is actually declining due to increasing solar magnetic flux, its content is inverted compared to the currently observed and debated temperature rise. An important point is this 14C variation is not due to any Earth bound forcing agent. The vertical rise (reduction in content) from about 1820 for example, is entirely the product of solar magnetic flux. The Sun's varying magnetic field is the only mechanism controlling 14C content and timing. Now, for me to suggest there is a correlation between the solar magnetic field strength and the current abnormal temperature increase I will have to show evidence of extraordinarily unusual magnetic field strength that will correlate the 14C content in the graph with the atmospheric warming since The Little Ice Age. http://www.ncdc.noaa...olanki2004.html Unusual activity of the Sun during recent decades compared to the previous 11,000 years Nature, Vol. 431, No. 7012, pp. 1084 - 1087, 28 October 2004. S.K. Solanki1, I. G. Usoskin2, B. Kromer3, M. Schüssler1, and J. Beer4 1 Max-Planck-Institut für Sonnensystemforschung (formerly the Max-Planck- Institut für Aeronomie), 37191 Katlenburg-Lindau, Germany 2 Sodankylä Geophysical Observatory (Oulu unit), University of Oulu, 90014 Oulu, Finland 3 Heidelberger Akademie der Wissenschaften, Institut für Umweltphysik, Neuenheimer Feld 229, 69120 Heidelberg, Germany 4 Department of Surface Waters, EAWAG, 8600 Dübendorf, Switzerland "According to our reconstruction, the level of solar activity during the past 70 years is exceptional, and the previous period of equally high activity occurred more than 8,000 years ago. We find that during the past 11,400 years the Sun spent only of the order of 10% of the time at a similarly high level of magnetic activity and almost all of the earlier high-activity periods were shorter than the present episode. Although the rarity of the current episode of high average sunspot numbers may indicate that the Sun has contributed to the unusual climate change during the twentieth century, we point out that solar variability is unlikely to have been the dominant cause of the strong warming during the past three decades." The researchers are limited by the current standard model to solar thermal radiation variability as the only possible cause. They are so close to the answer, even admitting a possible link between the unusual "rarity" of high sunspot numbers and "the unusual climate change during the twentieth century" My thesis simply requires that the molten iron of the Earth's outer core will vary over multi-million year time periods as the magnetic field changes in strength, and that is verified in the above. As the magnetic field strengthens the mantle is displaced by the thermal expansion from the increase in amplitude of the molten iron of the outer core. Current can only be created by magnetic fields, and magnetic fields can only create current. If one changes in strength the other will follow. As the outer cores molten iron increases in temperature from increased amplitude the liquid iron will expand. This thermal expansion will displace the mantle and release strain energy in the form of heat during its outward movement. The slow increase in the mantles circumference will require the crust to separate and adjust to release the continual tension and shear stresses. As the mantle is displaced outwardly the divergent plate boundaries are slowly separated, and as they do magma created from the strain energy at the crust/mantle boundary is forced under pressure into the slowly opening gap. This strain energy heat is produced as the mantle is forced to expand against gravity and its own viscosity, tearing its outer surface area and releasing the thermal energy. This is the variable thermal content we are now observing in our climate. It enters the ocean at the divergent plate boundaries. These boundaries form the largest mountain range on Earth. This system contains the world's largest continuous volcanic mountain range stretching 65,000 kilometers (40,400 mile) and occupies every ocean in the world including the Arctic Ocean sea floor. These volcanic structures rise to more than 3657 meters (12,000 ft.) high and are 1931 kilometers (1,200 miles) wide. While the ridge does run in the middle of the Atlantic Ocean it does not do so in all the others. While the average ocean crust depth is 8km (5 miles thick.) 1/5 as thick as the continents crust, it is just a mere 1 to 2 km (0.62 to 1.2 mi), at the point where the sea floor is continually formed by magma flowing into the fissure created by the opposing movement of the ocean crust. As seawater is forced under pressure into the layers of semi molten rock under the mid-ocean ridge (heat exchanger), it is heated to 300-400°C (572-752 F) and becomes extremely corrosive from volcanic chemicals. This high pressure superheated fluid is capable of dissolving the surrounding basaltic rock and leaching out metals and other elements. This fluid is also very buoyant and begins rising rapidly back to the surface, reentering the ocean at hydrothermal vents. Measurements show that heat flow is 10 times greater near the ridge crests than for ordinary oceanic crust. Heat flow is a measure of the heat escaping per second from a given area and is usually measured in watts/m2. The numerous hot springs at divergent plate boundaries show that significant heat is also carried out of the crust by convecting pore water. This data implies that a large source of magma lies beneath the ridge. This part is really important to note. This heat is not migrating from the core, which would take considerable time. This thermal content is produced at the crust/mantle boundary. The mantle makes up 85% of the Earth's volume; its thickness requires its outer surface to expand in proportion to its distance from the core creating tremendous strain energy in very small amounts of outer core/mantle boundary displacement. This mechanism connects the strain energy response to the magnetic field variability in almost synchronous timing. When the field generator's cycle changes after millions of years to lower amplitude the process reverses to slow contraction with the crust now slowly loading up compression in the form of a raised mass of gravitational potential energy that will be displaced into the trenches by the divergent plate boundaries recent infill. If the cycles are widely spaced, the resultant extra infill or a long decrease in outer core temperature will produce excessive kinetic movement of the crust. The resulting increased crustal compression will surpass the trenches rates of resistance and redirect the energy to the vertical displacement of rock into mountain complexes. This is how mountain ranges are created in such short time periods. The model provides a means to raise and load the entire plate matrix simultaneously. As the outer core's temperature lowers imperceptibly the mantle responds and moves in tandem. The crust would also likely move with the mantle but it can't because of the nice new slice of seafloor in the divergent plate boundaries that now shores its position and is blocking its pathway back to its beginning. The plates begin to preload with compression like a very flat Roman arch. The growing gravitational potential energy forces the plates to begin slowly sliding the opposite direction into the trench. Something else is happening here also; the plates all have different masses, from some of the largest like the Pacific or say Eurasia to the smaller down to the micro plates. The larger plates take the longest amount of time to unload while the smaller may be able to even slip some on the edges to release even faster. Referring to this claim by a plate tectonic opponent; "Plate tectonicists insist that the volume of crust generated at midocean ridges is equaled by the volume subducted. But whereas 80,000 km of midocean ridges are supposedly producing new crust, only 30,500 km of trenches exist. Even if we add the 9000 km of "collision zones," the figure is still only half that of the "spreading centers" (Smoot, 1997a)." In my model this would indicate that the subduction lags behind the expansion portion of the cycle. It takes longer for the plates to melt into the asthenosphere than it does to create the infill that leverages the ocean plates into the trenches. A full cycle would appear as a multi-million year period of thermal increase and expansion of the core, slowly displacing the mantle and in turn the crust. The resulting infill at divergent plate boundaries during this period will provide, during the following contraction, the leverage to slowly push the ocean plates into the trenches. These shorter periods of outer core expansion contrast to the much longer periods of thermal contraction of the outer core that provide the mantle's subsidence and subsequent oceanic plate subduction. The outer core thermal cycle is variable throughout its cycle, even from one maximum to the next in both timing and duration. Now let’s say we have an extra-long thermal expansion cycle and the divergent plate boundaries build up a very large infill, one of those that only occurs every 20 or 30 million years. When the outer core begins to cool and initiates the plate’s subduction the trenches will be, like before, slower to receive the plate material than the mantles withdraw. The compression begins building on the plates which are only able to overcome the trenches rates of resistances to a point. As the mantle continues down the plates are subjected to loads that require vertical movement of rock strata to relieve the massive compression building on the plates, this compression is in proportion to the length of time and degree of expansion in the previous cycle in relation to the degree of cooling in this cycle. So to summarize, the largest plates do not unload their gravitational potential energy completely before the next increase. The divergent plate boundaries quantitative dominance over the convergent trenches would suggest a vastly longer period of subduction is required over the preceding divergence boundary movement to process the entire raised mass inventory. The gravitational potential energy now unloading into the trenches was created at the end of the last thermal increase period. We are now observing the crustal compression from the previous thermal increase/decrease cycle. The models ability to raise the global tectonic plate matrix while shoring the retreating divergent plate boundaries with new magma provides a means where the initial thermal expansion energy ( the magnetic field generator's molten iron's thermal expansion) can be stored in the raised mass as (short term) gravitational potential energy, then slowly released as kinetic energy as the plates melt into the asthenosphere. Periods of excessive gravitational potential energy, the periods that exceed the trenches rates of resistance, will produce (long term) storage of the kinetic energy as mass in mountain complexes. "Earth's present-day magnetic field is, in fact, much stronger than normal. The dipole moment, a measure of the intensity of the magnetic field, is now 8 × 10²² amps × m2. That's twice the million-year average of 4× 10²² amps × m2. The divergent boundary activity that is now currently seen is due to this current thermal increase period. This is currently seen at the margins of the largest plates. The current rate of expansion is gradually removing much of that gravitational potential energy of the crust, energy that is currently in the form of raised mass. As the mantle continues to displace outward much of this crustal compression from the last cooling will be decreased before it can subduct into the trenches. There is much overlap in this process, there is not as one might think a clear change from divergent and subduction modes. They are overlapped with each other and with each ones outcome quite dependent on the other. These great mountain ranges like the Himalayas and the Andes required a very long period of divergent movement to put in place a very large section of new sea floor, sea floor that in turn would supply a very large raised mass during the following contraction cycle. This mass, displaced during the planetary cooling, then exceeds the trenches rates of resistance and diverts its gravitational potential energy into the creation of those mountain complexes. If either mode was of a reduce duration the mountain building period would not have occurred. There would have been instead a shorter period of lower or even higher thermal content, slowly going up and then slowly going down, with a simpler and common divergence/subduction cycle as a result. Similar to what we are observing right now. This is a partial list of the phenomena that this model can accurately predict. The planation that occurs before mountain ranges form The formation of mountain ranges - both continental margin and the difficult to understand until now continental interior The formation of divergent plate boundaries The formation of convergent plate boundaries The variation in ridge infill among the world’s divergent plate boundaries The basin and range area in the Southwestern North America Mariana Trench and why it is the deepest in the world Continental break-up Mid-ocean ridge offset faulting. Island chains such as the Hawaiians and the Emperor Seamounts Formation of island arcs Why some convergent plate boundaries are currently active while some are less and others now dormant Increased ocean thermal content Acidification of the ocean Carbon transported by the Global Ocean Conveyor to the surface and atmosphere. And the cause of the currently unaccounted 50% increase in the ocean’s thermal expansion rate. So, this is the simple connection between solar magnetic flux, the observable surface geology of Earth and the historically varying climate which results. There is even more evidence to consider than what was shown here, this is just the start.

-
Acme, I feel there is a distinct lack of objectivity with many members whose post on this thread. Ideally the challenges should be of a purely scientific merit and to that you have been true. But others have brought their personal prejudices as poorly disguised critical analysis. To be honest I really can't take seriously anything people say until they will offer up an alternative explanation for just a few of the many predictions of observations that I have posted for well over a year on this thread. You may feel I owe you some detailed answer to your query but you are mistaken, I will answer what I can and owe you nothing more. Your assertion of the importance of your question to this model is yours not mine. I weigh criticisms of this model against the answers it delivers, which far exceed those of the standard models. Can you offer an alternative answer to why the divergent plate boundaries have different metrics of infill? This model explains it with ease. Mountain building appears to have occurred in very short time frames at distinct periods in Earth's history, do you have a answer for that? This model does. The list is long and yet these are clearly avoided as if they don't exist while a question such as yours is proffered as critical to this models viability. This model is far reaching and interconnected with evidence that crosses between geology, climate, and solar magnetic phenomena. The list is long of what this model can answer and I will leave it to you to convince me of your questions importance in the totality of this models predictive abilities. For example; This member seems quite bothered by this threads concept. iNow, on 11 Sept 2013 - 2:03 PM, said: 'Can you demonstrate there has been a significant shift in tectonic dynamics since the industrial age, a shift that could account for the warming trend we're seeing and that is somehow different than shifts that have taken place through the last several thousand years?' So I did some research base on this model's plate dynamics and found what the model predicted, that Japanese records showed earthquakes tracking solar magnetic and climate histories. So there it is, climate variability is following solar magnetic flux very closely. And earthquakes occur specific to solar magnetic flux strength and increase proportionally "since the industrial age" while the climate warms proportionally also at the same rate. Three distinct phenomena all connected together. Should I dismiss this as coincidence based on your analysis; Acme, on 13 Jun 2014 - 08:41 AM, said: "Thank you, no. I read the entire thread and see nothing posted by you or Arc that supports the main thesis." REALLY!
-
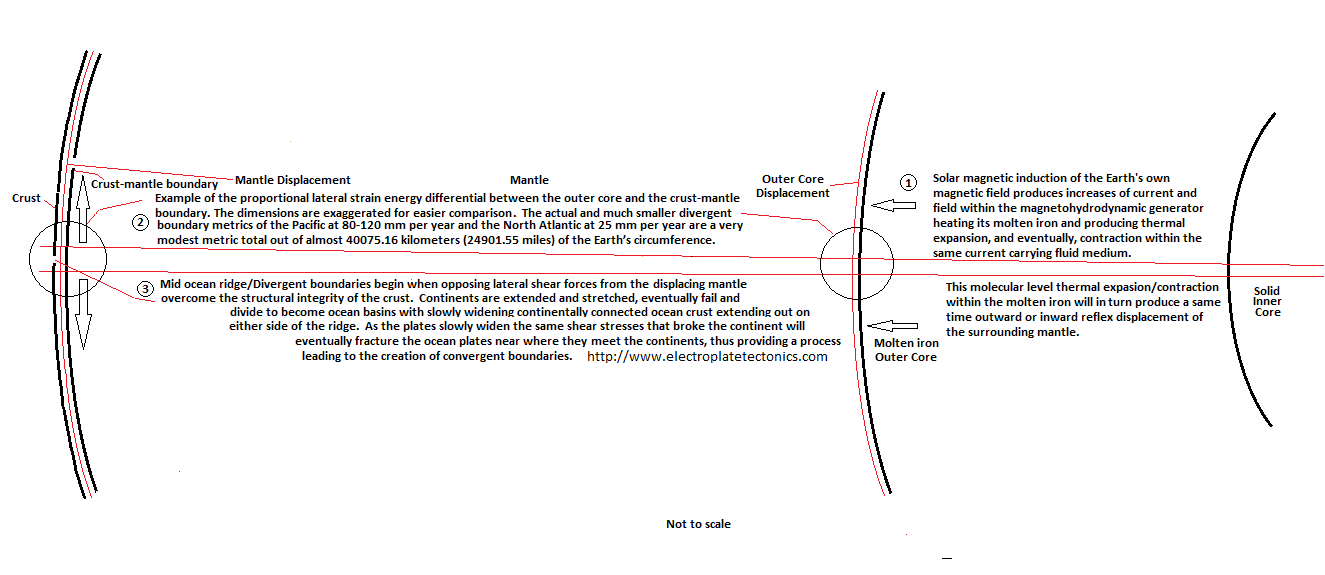
Acme, I think you are confused about the way this model's mechanism operates. I believe the proportions of energy that you think are at play here are not as great as you might think. The model contends that the current divergent boundary metrics are the result of a strain energy response to the outer cores thermal expansion. The mantle is 2,900 kilometres (1,800 mi) thick, that constitutes about 84% of Earth's volume. The Earth is 40075.16 kilometers in circumference with divergent boundary metrics measured in millimeters per year. The Pacific mid ocean ridge is the largest at 80-120 mm per year and the North Atlantic being 25 mm per year. The total lateral displacement of the Basin and Range extension varied from 60 – 300 km over 7+/- million years. Just 42 mm a year of displacement at the Basin and Range area over a period of 7 million years time will give you the 300 km of displacement. Seems a reasonable figure compared to current Pacific at 80-120 mm per year and the North Atlantic being 25 mm per year. The energy in molecular level thermal expansion is immense. But the thermal expansion energy displacing the divergent plate boundaries is not taking place in the mantle. The mantle is being outwardly displaced by the cores thermal expansion due to the increase of current and field by induction. The thermal expansion energy of core is multiplied by the thickness of the mantle similar to the inverse square law. The thermal expansion of the core's liquid iron and the inner core as well will move outward with no regard to the mass of the mantle trying to compress it. It will not be stopped. The maths for this are beyond my humble skills. But I have found a link with what I believe are the maths needed to calculate the mantle displacement and surface strain. I'm looking for some guidance HELP! by the capable forum members present. http://solidmechanics.org/text/Chapter4_3/Chapter4_3.htm Applied Mechanics of solids by Allan F. Bower Solutions to simple boundary and initial value problems 4.3 Spherically symmetric solution to quasi-static large strain elasticity problems 4.3.1 Summary of governing equations of finite elasticity in Cartesian components This section is intended to illustrate the nature of solutions to elasticity problems with large shape changes. 4.3.2 Simplified equations for incompressible spherically symmetric solids "A representative spherically symmetric problem is illustrated in the picture. We consider a hollow, spherical solid, which is subjected to spherically symmetric loading (i.e. internal body forces, as well as tractions or displacements applied to the surface, are independent of and , and act in the radial direction only)". 4.3.3 Pressurized hollow sphere made from an incompressible rubber As an example, consider a pressurized hollow rubber shell, as shown in the picture. Assume that Before deformation, the sphere has inner radius A and outer radius B After deformation, the sphere has inner radius a and outer radius b The solid is made from an incompressible Mooney-Rivlin solid, with strain energy potential Due to copyright limits I cannot post more than this but it looks to me to be the correct calculations for this model. It should require a very small amplitudinal change in intensity to initiate the needed thermal expansion of the core. The mantle will provide the mechanical advantage to multiply the very small thermal expansion at the core into the larger mantle surface displacement at the crust/mantle boundary while creating the hydraulic magma to displace the crust and fill the divergent plate boundaries.
-
Yes, I am aware of these ideas. But, they do lack an overall consistency with observations. They seem to be invented to solve a particular problem and the modified as needed to correct inconsistencies as the arrive. Sort of a Rube Goldberg machine approach to geology. Sorry, well I don't suggest there is a magnetic attraction of any kind that would cause drag or any similar effects. This is the induction of a massively smaller planetary magnetic field by a larger solar magnetic field. The magnetic connection between the Earth and its field generator adds a degree of separation between the terrestrial Earth and the solar magnetic field, this may reduce this effect that you imply. Isn't the connection between the fields after all.
-
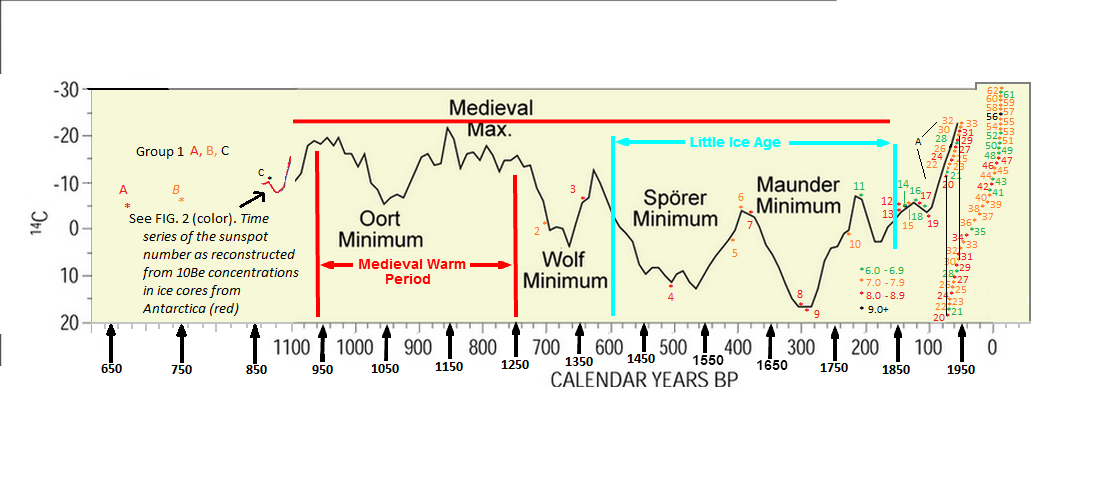
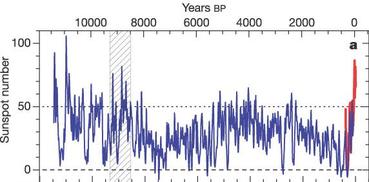
Hi Essay, people have misinterpreted this model since the very beginning. It is unique in that it combines the the mind numbingly boring geology (I don't think that though, It's my favorite science) with the contentious climate change. "and decided it was an obvious attempt to grasp at some newly discovered ersatz [and non-anthropogenic] mechanism to explain rapid climate change" Congratulations, you responded pretty much like everyone else. People will either like it or hate it base on which side of climate change debate they fall on. But, this is about geology, if it resembles something else it may be a coincidence or of a similar phenomenal origin. If you read this threads beginning you can see it outlines a very original interpretation of geology. There is tremendous evidence of rapid, large scale resurfacing of the earth. This "sudden" movement requires a mechanism that can store energy for millions of years, or even tens of millions of years, in the earths crust. This energy is gravitational potential energy and it will impose millennial scale degrees of compression into the Earth's crust. Below all of this activity is the magma at the crust/mantle boundary created by a strain energy response to the outer core/field generators variable over millennia. So, there is a short outline that should at least give a starting point to discuss your points. I am using Sunspot data, it contains within its measurements of sunspots an indication of the strength of the Sun's magnetosphere or interplanetary magnetic field. A large part of this model is supported by the 14C tree ring and 10Be data. These sources of data are controlled very accurately by the Sun's continuously changing field strength. Bond had noted a link between 14C content and drift ice debris in seafloor sediments, this is, according to this model, an ocean thermal content directly connected to solar magnetic strength, but how? What would make the ocean cool enough at specific times of low magnetic field strength to allow icebergs to travel an extra distance south. Enough of a distance that the rocks within the berg, in place from its glacial origin, will stand out in defined layers of seafloor sediment where they were dropped in chronologically narrow periods of quasi-1,500 year cycles. http://en.wikipedia.org/wiki/1500-year_climate_cycle These 1470 +/- 500 year cycles show in ice core samples as well. So Milankovitch cycles are much wider and probably overlay the Bond cycles in some way. Likely imposing a positive and then at times negative effect on the Bond cycle, but I have tried to stay away from Milankovitch cycles to avoid drowning myself in complexities. ftp://ftp.nodc.noaa.gov/pub/data.nodc/woa/PUBLICATIONS/grlheat05.pdf "In terms of the causes of the increase in ocean heat content we believe that the long-term trend as seen in these records is due to the increase of greenhouse gases in the Earth’s atmosphere [Levitus et al., 2001]. In fact, estimates of the net radiative forcing of the Earth system [Hansen et al., 1997] suggest the possibility that we may be underestimating ocean warming. This is possible since we do not have complete data coverage for the world ocean However, the large decrease in ocean heat content starting around 1980 suggests that internal variability of the Earth system significantly affects Earth’s heat balance on decadal time-scales." This is the difference between this model and existing theories on planetary heating. Sunspots are a solar magnetic phenomena but every conclusion on any planetary thermal forcing in relation to sunspots always defers to "radiative forcing of the Earth system". My model suggests deep ocean heating from the strain energy at the crust/mantle boundary imposed in geologically short and long time frame periods. These periods do not just suggest climate or ocean warming, they suggest tectonic movement if the solar magnetic energy needed is available. When you examine features like the Basin and Range; http://en.wikipedia.org/wiki/Basin_and_Range_Province "The average crustal thickness of the Basin and Range Province is approximately 30 – 35 km and is comparable to extended continental crust around the world. The crust in conjunction with the upper mantle comprises the lithosphere. The base of the lithosphere beneath the Basin and Range is estimated to be about 60 – 70 km. Opinions vary regarding the total extension of the region, however the median estimate is about 100% total lateral extension. Total lateral displacement in the Basin and Range varies from 60 – 300 km since the onset of extension in the Early Miocene with the southern portion of the province representing a greater degree of displacement than the north." Then the concurrent climate; http://en.wikipedia.org/wiki/Miocene#Climate "Although a long-term cooling trend was well underway, there is evidence of a warm period during the Miocene when the global climate rivalled that of the Oligocene. The Miocene warming began 21 million years ago and continued until 14 million years ago, when global temperatures took a sharp drop - the Middle Miocene Climate Transition (MMCT). By 8 million years ago, temperatures dropped sharply once again, and the Antarctic ice sheet was already approaching its present-day size and thickness. Greenland may have begun to have large glaciers as early as 7 to 8 million years ago, although the climate for the most part remained warm enough to support forests there well into the Pliocene." You get a sense of the energy released over maybe 7 million +/- years that stretched the Pacific Plate out between two points of resistance, one is the Pacific Plate's edge subducted at the Mariana Trench to the west and the other is the subducted edge of the Pacific Plate under the North American continent to the East. This is evidence of extensional forces that are easily accomplished by mantle displacement of very small degrees. These extensional events coincide with climatic warm periods. Here's another; This study below shows such an extensional event in Antarctica, also during the Miocene, but of course suggests the current standard models reason, mantle upwelling in regards to a plume as a cause. http://geodynamics.u...nts/frbdm08.pdf "Our study documents two subsequent episodes of deformation occurring from Middle Miocene onward, concurrently with the McMurdo volcanism in the Admiralty Mountains region. The first is dextral transtensional where as the second is purely extensional." And of course my model suggests the strain energy enters the ocean through the 80,000 km (49,700 mi) long Mid-Ocean ridge system and is then delivered by the thermohaline circulation of the world ocean. This NASA article about Antarctica warming in the Miocene expresses this nicely. http://www.nasa.gov/...ca20120617.html "Scientists began to suspect that high-latitude temperatures during the middle Miocene epoch were warmer than previously believed " "The climate was suitable to support substantial vegetation -- including stunted trees -- along the edges of the frozen continent." "Along the edges" where all that ocean thermohaline circulation heat is warming the atmosphere. "the research team found summer temperatures along the Antarctic coast 15 to 20 million years ago were 20 degrees Fahrenheit (11 degrees Celsius) warmer than today, with temperatures reaching as high as 45 degrees Fahrenheit (7 degrees Celsius). Precipitation levels also were found to be several times higher than today." "The peak of this Antarctic greening occurred during the middle Miocene period, between 16.4 and 15.7 million years ago." So there appears to be a correlation between surface extensional events and warmer climate periods. And as I have shown there is ample evidence of a correlation to the mountain building period of the Himalayas and the cooling climate. This graph below shows this cooling, starting at the end of the Miocene (not shown) beginning at the left side of the top graph, and continuing through the mountain building period; ANNALS OF GEOPHYSICS, SUPPLEMENT TO VOL. 49, N. 1, 2006 Mountain uplift and the Neotectonic Period CLIFF D. OLLIER School of Earth and Geographical Sciences, University of Western Australia, Perth, Australia "According to Wu et al. (2001) from the Pliocene to the Early Quaternary (5-1.1 Million years) the Kunlun Pass area of the Tibetan Plateau was no more than 1500 m high and was warm and humid. They write: «The extreme geomorphic changes in the Kunlun Pass area reflect an abrupt uplift of the Tibet Plateau during the Early and Middle Pleistocene. The Kunlun-Yellow River tectonic movement occurred 1.1-0.6 Million years.» Zheng et al. (2000) concluded from sediments at the foot of the Kunlun Mountains that uplift began around 4.5 Million years.)" By the end of the Miocene the core temp began to cool and the mantle slowly contracted putting the crust into compression, starting a long period of subduction. As the crust is increasingly loaded with stored compression from the contracting mantle, due to the resistance in the subduction trenches, the crust begins a period of global mountain building that occurred during the "Early and Middle Pleistocene." The compression continued to bleed off into the trenches until the crust began a slow and low energy period of activity. It's interesting to think the solar magnetic energy cycle that extended the Basin and Range was stored as mass in the crust then converted by gravity to kinetic energy that then lifted the mass of the Himalayas millions + years later.
-

Does Humour Have a Place on SFN?
arc replied to Ophiolite's topic in Suggestions, Comments and Support
If humorous content was not allowed here I would never have joined SFN. It is a stress relieving device in many instances and the well timed punch line or self deprecating joke can break down barriers between opponents and avert what could have been a potentially argumentative incident. Science and humor are both creative pursuits, both an attempt to describe something in a new and unique way and both providing a degree of joy if successful. Humor just requires a surprising punch line to work its magic. While science requires accuracy. -
That's a good boy! I knew your bark was worse than your bite . . . . . . . now let's see if we can get you neutered. Exotic huh, you should see where mantle convection has wandered off to. The decades spent looking for signs of convection and then mantle plumes has lead to a meandering chain of inventing gizmos and whatchamacallits to explain the discrepancies in their models. Here's some of their imaginative solutions; mantle wind, Euler pole jerks, mantle roll, magma tunnels, hidden plate boundaries, lithosphere drift, superplumes, lateral flow, group motions of "hot spots" and my favorite, plume head decapitation. I would tend to trust a model that shows a consistent ability to predict not only the time of a climate temperature change, but also the degree. Take for example these two graphs, one is temperature from ice core data. And the other is solar magnetic strength reconstructed from 14C in tree rings. According to the graphs above our current warming seems to be proportionate to the current solar magnetic flux level. Now, that alone would be as much of a convincing argument as that of anyone claiming the warming since the end of the Little Ice Age is proportional to the release of anthropogenic Co2, and then claim, it therefore must be the cause. But look what else can be observed in the two graphs. The historical solar magnetic levels are not only concurrent to the historical temperature variation but proportionate to the temperature. When the temperature was lower so was the solar magnetic flux, and when the solar magnetic flux was unusually high the Earth was recorded to be proportionally warmer. Pt. 1 on the left occurred at the end of the Younger Dryas cold period that saw a rapid return to glacial conditions in the higher latitudes of the Northern Hemisphere between 12.9–11.5 ka BP. The high solar magnetic energy of Pt. 1 of D2 correlates to when the temperature climbed out of the Younger Dryas cold period at Pt. 1 of D1. This is no different in correlation then your " anthropogenic Co2 = temperature rise" that is offered as proof of human causation. I am simply showing a much broader and more accurate picture of the correlation and causation connection than your model's data can provide. You should take care to understand the cold events that are shown in those two graphs. The Younger Dryas cold period just before point 1. and the 8.2 Kyr Event at Pt. 3 are very easily seen in graph D2, the 8.2 Kyr's energy level decrease from the graph’s 4th highest peak of Pt.2 is clearly shown. “The 8.2 kiloyear event was a sudden decrease in global temperatures . . . .and lasted for the next two to four centuries. Milder than the Younger Dryas cold spell that preceded it, but more severe than the Little Ice Age that would follow, the 8.2 kiloyear cooling was a significant exception to general trends of the Holocene climatic optimum. During the event, atmospheric methane concentration decreased by 80 ppb or 15% emission reduction by cooling and drying at a hemispheric scale.” This becomes quite sobering when you consider; http://www.ncdc.noaa...olanki2004.html Unusual activity of the Sun during recent decades compared to the previous 11,000 years Nature, Vol. 431, No. 7012, pp. 1084 – 1087, 28 October 2004. Graph C “According to our reconstruction, the level of solar activity during the past 70 years is exceptional, and the previous period of equally high activity occurred more than 8,000 years ago. We find that during the past 11,400 years the Sun spent only of the order of 10% of the time at a similarly high level of magnetic activity and almost all of the earlier high-activity periods were shorter than the present episode.” This warming that we are currently enjoying is likely to end soon and the new norm will probably resemble the earlier cooling events of the holocene, the Younger Dryas, the 8.2 Kyr and the Little Ice Age. Like it says above; it's only been at this level 10% of the time during the last 11,400 years and all of them were shorter. Two hundred or more years of Little Ice Age temperatures won't be too bad if you can keep in mind it could have been the temperature of the other two events. Eventually, before the Holocene is over, it will get warm again. Probably long enough to reforest the Canadian northern territories as far north as it did during the last interglacial. Hi Essay, welcome to my plate tectonic thread. What took you so long! I believe those two posts are iNow's first here also. On what time scale does this supposed "strain energy" affect ocean heating? All the time. Solar magnetic flux is always changing, it is well documented. The Earth's magnetic field is always changing, it is well documented. According to the model these two input a varying amplitude into the outer core's liquid iron causing it to thermally expand. This leads to what is currently observed at the divergent plate boundaries. The outward displacing mantle produces strain energy in response to the expansionary forces. A smaller amount is produced closest to the outer core and increases the farther away from the core you get. It culminates with the most strain energy at the crust mantle boundary where the mantle must displace the greatest degree to the molten outer core's thermal expansion. This is where the magma is produced which will support the tectonic plates and which is then extruded into the divergent plate boundaries as they are separated. I don't want to dump a huge amount of content on you, I will just say this atmospheric phenomena we are discussing is a byproduct of the model's plate tectonic mechanism. The resurfacing, or more exactly, the extensional events like the Basin and Range in the Southwest U.S. coincide with periods of warmer climate, while the mountain building episodes occur during times when there is large scale reduction of mantle displacement. The geologic events are the driver of the planets variable climate. Our planet's recent warming since the early 1800's coincides with the geologic movement predicted by this model. This image below is in regards to the correlation between solar magnetic flux, climate and earthquake activity. Please refer to my blog; http://blogs.scienceforums.net/arc/subversive-content/ This will outline for you the connection between the solar magnetic/geologic/climate connection. You will also find an outline of the model there as well as other surprising ideas in these regards.
-
Acme, if I ever acquire a pitbull I will undoubtedly name it after you. Fortunately I need not compile a monumental quantity and quality of evidence required to meet your superior discernment. All that is required of this model is that it provide predictions of observations superior to the models currently in use. And thankfully the bar is really low in that regard. For plate tectonics this sums up the competition nicely; http://www.dst.uniro...antle_Dynamics_ "At the moment there is no way to link mantle dynamics and plate kinematics at the surface". . . . . . . . "In other words, mantle convection alone seems not able to generate plate tectonics." I believe I've beat the standard model quite handedly in this regard. The standard model's predictions of observations amount to "0" and leave an opportunity to someone interested in the subject to take the lead with a simpler and cleverer model. Hey, don't blame me. They've had a big head start with many players on the field, they should have some predictions to show for it. Now about the climate forcing. The whole anthropologic causation argument going on right now is almost entirely predicated on the notion that the climate began warming when fossil fuel became increasingly used by humans, so the cause of the warming climate must be the human production of atmospheric Co2 from burning carbon fuels. http://www.scienceforums.net/topic/74977-reasons-not-to-worry-climate-change-debate/page-4 So I have shown solar magnetic synchronisation to climate variability going back 11,400 years. Compare the work below to the claim above that cannot explain any other climate variation but makes a Correlation = causation claim based completely on a lack of information and understanding in regards to the past climate. What caused the Younger Dryas cold period? The Medieval Warm Period and the little Ice age? They don't have a mechanism for all of that climate change but are sure its anthropologic for the present situation. Read this material below and see what this model can do with predicting climate in the past and present. http://www.ncdc.noaa.gov/paleo/pubs/alley2000/alley2000.html “This figure, adapted from the NRC (2002) report Abrupt Climate Change: Inevitable Surprises, comes from data in Alley (2000) and Cuffey and Clow (1997). It shows the clear, abrupt increases in temperature in the Greenland Ice Sheet Project 2 (GISP2) record at the end of the last glacial period and at the end of the Younger Dryas. The cooling as temperatures returned to the glacial conditions of the Younger Dryas takes place over a longer period in a step-wise fashion.” See also: ftp://mtarchive.geol.iastate.edu/data/2005/stuff/504_papers/Younger-Dryas.pdf Click on images to enlarge Graph A The data from Alley, above, was used to make this graph (B) below by Giorgiogp2 who has no connection to this author or this paper and was provided through Wikipedia Creative Commons. It was compiled from Data source: http://www.ncdc.noaa.gov/paleo/pubs/alley2000/alley2000.html, the same source as graph A above. Graph B I took this graph above and reversed it to have the most recent events on the right so it could then be more easily compared to the solar magnetic 14C content data in the graph below, that I had previously used to correlate the unusual climate warming of the later part of the 20th century. http://www.ncdc.noaa.gov/paleo/pubs/solanki2004/solanki2004.html Unusual activity of the Sun during recent decades compared to the previous 11,000 years Nature, Vol. 431, No. 7012, pp. 1084 – 1087, 28 October 2004. Graph C “According to our reconstruction, the level of solar activity during the past 70 years is exceptional, and the previous period of equally high activity occurred more than 8,000 years ago. We find that during the past 11,400 years the Sun spent only of the order of 10% of the time at a similarly high level of magnetic activity and almost all of the earlier high-activity periods were shorter than the present episode.” I then plotted the points of both the solar magnetic flux and temperature in synchronized chronologic order between the two graphs, now referred as D1 and D2. Graph D1, D2 What stands out first is the extremely high magnetic energy at 1 to the left on graph D2, the energy level is higher than even the unusually high solar magnetic level mentioned above and shown as the red vertical line above Pt. 23. Pt. 1 on the left occurred at the end of the Younger Dryas cold period that saw a rapid return to glacial conditions in the higher latitudes of the Northern Hemisphere between 12.9–11.5 ka BP. The high solar magnetic energy of Pt. 1 of D2 correlates to when the temperature climbed out of the Younger Dryas cold period at Pt. 1 of D1. Let’s look at graph A again for additional clarity. As you can see the extreme solar magnetic energy of point 1 occurred simultaneously with the temperature increasing as it climbed out of the Younger Dryes, a remarkable correlation of two extreme events. It should also be noted this rise is as precipitous as the current solar magnetic energy level at a (Red) seen in graph C. Graph C To have these two extreme warming events coincide with proportionate solar magnetic flux is beyond what could be considered coincidence; add to this the lesser but still concurrent events between these two extremes and this evidence should convince even the most reluctant observer that the current model is lacking in its abilities to accurately portray the observable world. The rarity of this high magnetic energy is clear; “We find that during the past 11,400 years the Sun spent only of the order of 10% of the time at a similarly high level of magnetic activity and almost all of the earlier high-activity periods were shorter than the present episode.” Graph D1, D2 The 8.2 Kyr Event at Pt. 3 is very easily seen in graph D2, the energy level decrease from the graph’s 4th highest peak of Pt.2 is clearly shown. “The 8.2 kiloyear event was a sudden decrease in global temperatures . . . .and lasted for the next two to four centuries. Milder than the Younger Dryas cold spell that preceded it, but more severe than the Little Ice Age that would follow, the 8.2 kiloyear cooling was a significant exception to general trends of the Holocene climatic optimum. During the event, atmospheric methane concentration decreased by 80 ppb or 15% emission reduction by cooling and drying at a hemispheric scale.” What is important to understand is the spacing between the vertical lines such as Pt.3 shows a rather unusually large gap indicating an extended period of low magnetic energy. This would allow the dissipation of planetary thermal content and a substantial drop in average temperatures as the cooling ocean pulls the atmospheric content down. Other pronounce points such as 4-5, 10-11 and 15-16 allowed enough cooling (gaps between lines) to show as such on graph D1. This models ability to explain this correlation gives credence to its accuracy. The surface temperature variation is simply a byproduct of the Earth’s field generator’s responses to the variations in the Sun’s magnetic field generator. The atmosphere is 0.000 001 percent of one earth mass (or 1/1,200,000) and the ocean is 0.022 percent (1/22,000) of one earth mass, they are by large surface area exposure, in direct contact to the remaining 99.978+ percent of the planet’s thermal content. The mantle constitutes about 84% of Earth’s volume with temperatures that range between 500 to 900 °C (932 to 1,652 °F) at the upper boundary with the crust. This model simply acknowledges the dominance of the terrestrial mass’ thermal content, and its ability, without measurable content loss, to direct the oceans thermal content in measurable gains or losses. This permits the ocean’s variable thermal content to be a forcing agent of Earth’s climate. Let’s look at something to illustrate this concept. ftp://ftp.nodc.noaa.gov/pub/data.nodc/woa/PUBLICATIONS/grlheat05.pdf Warming of the world ocean, 1955–2003 S. Levitus, J. Antonov, and T. Boyer National Oceanographic Data Center, NOAA, Silver Spring, Maryland, USA Received 22 September 2004; revised 24 November 2004; accepted 8 December 2004; published 22 January 2005. “Thus, a mean temperature change of 0.1 C. of the world ocean would correspond roughly to a mean temperature change of 100 C. of the global atmosphere if all the heat associated with this ocean anomaly was instantaneously transferred from the ocean to the atmosphere. This of course will not happen but this computation illustrates the enormous heat capacity of the ocean versus the atmosphere.” The volumetric heat capacity of the terrestrial Earth should dominate the ocean even more so than the ocean over the atmosphere. The thermal energy at the crust mantle boundary should provide thermal content into the ocean at the mid ocean ridge, driving the thermohaline circulation (THC) that carries this thermal content to the ocean surface. The hypothesis contends that strain energy derived heat content at the crust mantle boundary is a forcing mechanism. That if a thermal content at the boundary was in a fractionally lower level than it is now the deep ocean temperature would be lower than it is now. The reduced heat content of the ocean would then express a lower surface heat flux. And due to this, the solar input would not be able to furnish surface temperatures at current levels which would in turn produce increased snowfall amounts and lower seasonal temperatures. According to the model a very small amplitude increase of the magnetic field generator would produce the currently observed divergent plate boundary movement and impose thermal content into the ocean from the concurrent strain energy released from the mantle’s displacement. The fact that we are currently in an inter-glacial during an ice age period that began 2.6 million years ago suggests that the planet has been in a thermal see-saw with the temperature balance point at close proximity to the forcing agent, where a fractionally small variable is able tip the temperature balance in the opposite direction. The longer periods of the glacial over the much shorter inter-glacial suggests that after an initial fractional ocean temperature decrease the resulting sunlight reflecting snow produces an albedo feedback that quickly reduces the effects of solar thermal radiation. The model requires a small heat content bias increase from strain energy at the crust/mantle boundary to warm the ocean to reverse the glacial mechanism. http://en.wikipedia.org/wiki/Ice_age “The current ice age, the Pliocene-Quaternary glaciation, started about 2.58 million years ago during the late Pliocene, when the spread of ice sheets in the Northern Hemisphere began. Since then, the world has seen cycles of glaciation with ice sheets advancing and retreating on 40,000- and 100,000-year time scales called glacial periods, glacials or glacial advances, and interglacial periods, interglacials or glacial retreats.” According to the model, around 2.58 million years ago the Earth’s field generator lowered its energy level from a previous higher level period. Although the field generator output varies continuously, this was a new lower average compared to the previous and brought the Earth into the current Ice Age period. The interglacials, like the one we are in now, show that the field generator can vary enough, even in short time frame increases, to impose thermal content into the ocean/atmosphere in what are consistent periodicities. These timed events are consistent enough to suggest solar origins. These are rapid changes in the thermohaline circulation (THC) temperature, and are so small in content compared to the Earth’s terrestrial content that they are inconsequential to it. And even more important, the heat associated to ocean content forcing is determined by the strain energy response to the field generator’s output. The terrestrial volumetric heat is there as a base line temperature. This heat content that periodically warms the ocean/atmosphere through the millennia is produced by the strain energy response to the outward displacing mantle. During this time the tectonic plates are slowly extending and the divergent boundaries are filling with magma. And of course if the boundaries are active due to the solar magnetic forcing we would see a synchronization to any long period records of earthquake activity.

-
Hi Essay, do we know that for sure? I have always assumed the ocean basin and continental land mass ratio has been relatively stable due to subduction occurring as some ocean basins reduce in size (as the Pacific Ocean currently is) while somewhere else a different ocean basin is enlarging as is the case of the Atlantic currently.
-
WOW, you put a lot of work into that. Very detailed, with many things I didn't know. I don't know why I like biographical subject matter so much, I guess I like getting the goods on people.
-
Lets stick to subjects of a scientific nature. People, places or things related to science. I like to learn the background of the people and the circumstances that made them and their work such important historical milestones.
-
You, I am sure, are correct. I am not adequately educated in these matters. But I always try to take the safe position and view things in regards to its probability with the standard "very unlikely" or "highly unlikely" or everyones favorite - most probably very highly unlikely. I just have seen in the past history of science, and generally with anything regarding human understanding of nature, there have been some real surprises. And you have to admit we have not seen anything yet when it comes to "what's out there". I would appreciate your opinion on why a more durable core as mention by me and others, would not help this planet's structure survive the forces involved, even if for a short while longer, regardless of how short of time it is. Can you conceive of any circumstances that could produce a viable result. A great science fiction plot could be at stake!
-
All good ideas! I'm still thinking about something using the profile update. Does anyone know of any simple word games that would work like maybe a jumbled word game or even those wheel of fortune phrases, person, place or thing type of game. How about you post a scientific related category - a person, place or thing with a association to science. Then give a clue. Example: Person - place of birth is a funny name. Follow up as soon as you can with another clue if needed or a congratulation. Second clue: Was an apprentice to a bookbinder. Keep going until someone guesses correctly. We may need to have a set minimum of information, maybe even place of birth, early education and something regarding character. Example: Person - place of birth is a funny name. Was an apprentice for seven years to a bookbinder. Refused a knighthood. And please remember I am most probably not as smart as you so don't make them too hard.
-
Lay off the Ancient Aliens, It'll rot your brain.
-
I have been kicking around an idea for a side game to play here at the forum using the profile update feature, I thought it could work using the members posts in a thread in some way. At first I imagined a "six degrees of separation" sort of arrangement. But it would probably zero in on some key member who is somehow linked to every member and post in some easily defined chain of associations. Hmmm . . . . who could that be I wonder? Now I'm thinking some kind of poker hand. We give each moderator and expert a face card I.D. and . . . . . .na bad Idea. OK, I give up any suggestions?
-
Considering how vast the cosmos is . . . . . . . . I can't commit to that term.
-
Taking inspiration from the science fiction perspective, could we beef up the structure of this planet? Can a different origin be contrived for a solid iron ring to form the core of the toroid. Maybe a remnant of a core from a cold dead star, broken into pieces by some type of collision or ? The ring shaped piece of iron with an uneven surface resembling irregular facets drifted through the cosmos and was caught up with other star dust into a newly forming solar systems accretion disc. Now, with this heavily magnetised toroidal iron ring in place could a crustal layer form. Maybe a completely watered planet producing inductive heating from the salt laden waters circulating the heavily magnetized core ring. This should solve the stress issues. It would not flatten toward the poles and the salt water circulating in one direction may in time smooth the ocean floor surface while the rotating water helps stabilize the planet's rotation. In time the core could reshape into a more uniform ring and produce in the thick mud a new deep water life based around electrosynthesis.
-
Mining Planets in Solar System? Feel Free to Get Iron From Mars?
arc replied to Nicholas Kang's topic in Speculations
If you are referring to my post, mining Mars doesn't anger me at all. I am amused by peoples irrational objections to such things. BTW I accidently clicked the up vote button, but thats OK, you are doing fine with this thread and I give it for that. -
Mining Planets in Solar System? Feel Free to Get Iron From Mars?
arc replied to Nicholas Kang's topic in Speculations
I have to be honest, I somewhat look forward to the reaction of those who will transpose their environmentalism to what is most probably a sterile planet. Will they or can they in their minds differentiate between a sterile asteroid and a sterile planet? Will they insist on a no mining/science only status? Will it be only for some planets? What would be the reaction if you could observe with optical telescopes in orbit above Earth or Mars a dust plume rising from the mine site into the thin martian atmosphere. I can feel the angst already. -
And the scars on my knuckles.