
arc
Senior Members
-
Joined
-
Last visited
Everything posted by arc
-
 Hopefully she won't notice I wrecked her car.
-
Dogs Who Learned The Hard Way Not To Eat Bees. http://www.buzzfeed.com/erinchack/dogs-who-learned-the-hard-way-not-to-eat-bees?bffb These dogs have made the rite of passage that every dog seems to make, some more times than you would think a dog's memory would allow. But then again, people won't stop eating Habaneros either.
 I'll bet a triple with cheese she's not saying; "Could I get a small garden salad without dressing and a water."
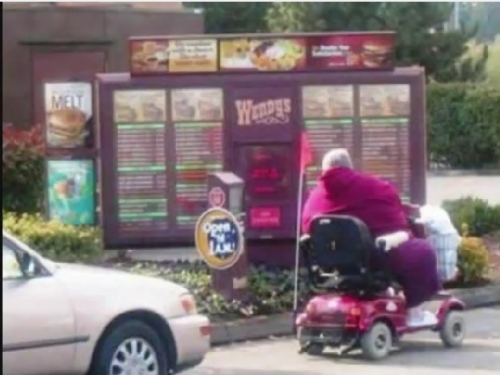 Well, I see this whole food cart thing has finally come to its eventual end result.
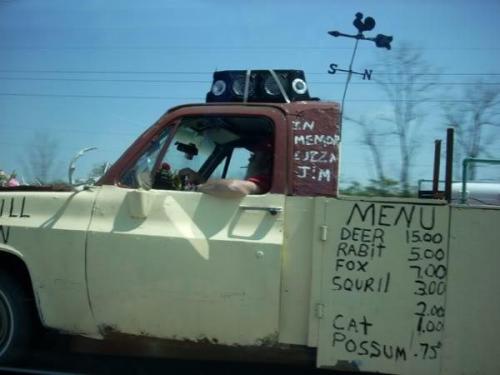 Moon, you forgot about the sign in the front yard.
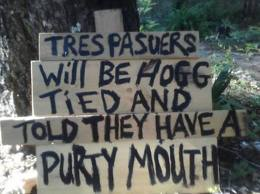 Taking your family to a second rate amusement park. . . . . . $98.00 Watching your child slide out of a giant dog's hemorrhoid inflamed butt. . . . Priceless!
 Larry's mind swirled from euphoria as the world flew by in a blur. Could this be real! - He struggled to stifle his joyous exuberance and focus his racing mind on this wondrous creature beneath him. Its power and strength seemed oblivious to his presence as it bounded forward - Larry knew at that moment . . . . His life . . . . . His tribe's destiny . . . . Would never be the same!
 I debated whether to write something or just let it talk for itself. I finely decided the least said the better.
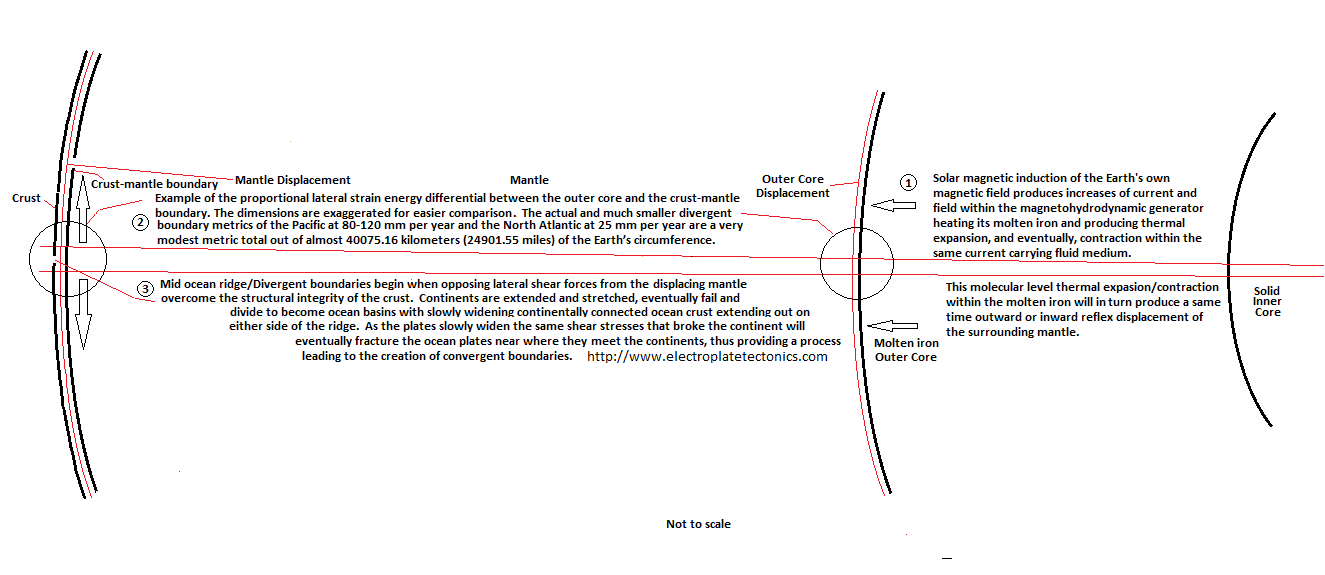
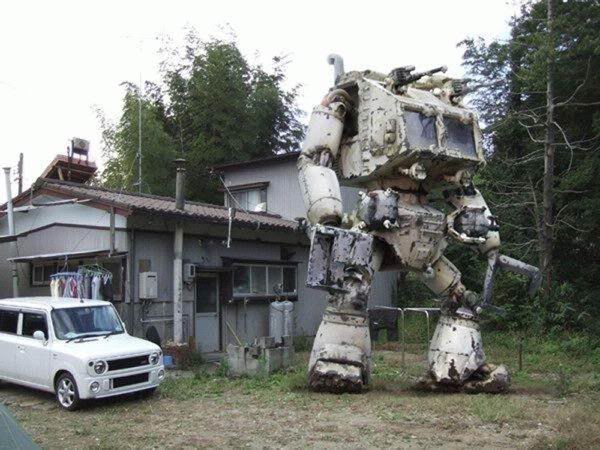
As would be expected - No matter where you put the selector, it always comes out on the dark side.
I debated whether to write something or just let it talk for itself. I finely decided the least said the better.
As would be expected - No matter where you put the selector, it always comes out on the dark side. So, then I say to my neighbor; "This is a bad area, you should get a car alarm"
 I think it would appear on numerous traffic control radar and would be accounted for or considered unidentified and tracked closely, post 911 style. Are there any runways anywhere that size that we don't know about or haven't already looked at with satellites since this developed? It would have to be a fairly large facility, yet not have any spectators that would comment about an unusually large plane for such a obscure airport.
For sale - demolition derby car. 2012-2013 NATIONAL CHAMPION. Arbitrary rule revision for this season changed the ambiguous and contentiously debated section titled "Auxiliary Armor" to no longer be interpreted as, or “allow anywhere on the premises”, a 75mm rapid fire cannon. My loss is your gain.
I think it would appear on numerous traffic control radar and would be accounted for or considered unidentified and tracked closely, post 911 style. Are there any runways anywhere that size that we don't know about or haven't already looked at with satellites since this developed? It would have to be a fairly large facility, yet not have any spectators that would comment about an unusually large plane for such a obscure airport.
For sale - demolition derby car. 2012-2013 NATIONAL CHAMPION. Arbitrary rule revision for this season changed the ambiguous and contentiously debated section titled "Auxiliary Armor" to no longer be interpreted as, or “allow anywhere on the premises”, a 75mm rapid fire cannon. My loss is your gain.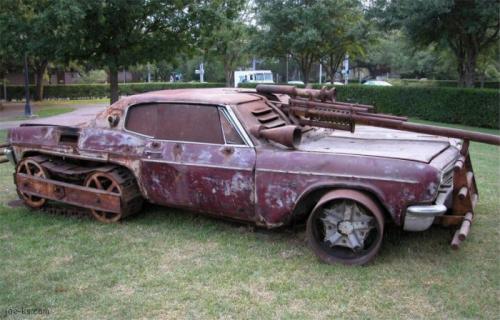 I think it was inevitable . . . . that eventually . . . . given enough time . . . . a mobile home park somewhere would end up looking like this after a tornado.
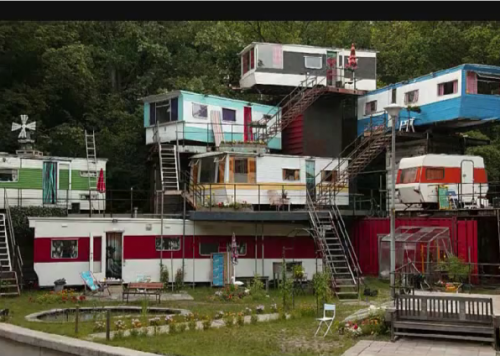 For sale - Renaissance custom chopper. Reportedly built and ridden by Leonardo da Vinci.
 I hope you don't mind the ad in the beginning, you can skip it in 5 sec. but I think its worth it. This guy is the groom's older brother and best man and of course responsible for the toast, or should I say roast and does the best job at this I have ever seen. http://www.youtube.com/watch?feature=player_embedded&v=c_wr5P7thKM
Yeah, but they will lie through their horse teeth to stay out of the dutch oven.
For sale - Portable 1/hp hay powered wood splitter/fertilizer maker. Comes with spare power unit. Can be quickly converted to personal transportation or lunch, as some buyers find the motor drives quite tasty if properly maintained marinated - hence the spare power unit. Trades considered.
I hope you don't mind the ad in the beginning, you can skip it in 5 sec. but I think its worth it. This guy is the groom's older brother and best man and of course responsible for the toast, or should I say roast and does the best job at this I have ever seen. http://www.youtube.com/watch?feature=player_embedded&v=c_wr5P7thKM
Yeah, but they will lie through their horse teeth to stay out of the dutch oven.
For sale - Portable 1/hp hay powered wood splitter/fertilizer maker. Comes with spare power unit. Can be quickly converted to personal transportation or lunch, as some buyers find the motor drives quite tasty if properly maintained marinated - hence the spare power unit. Trades considered.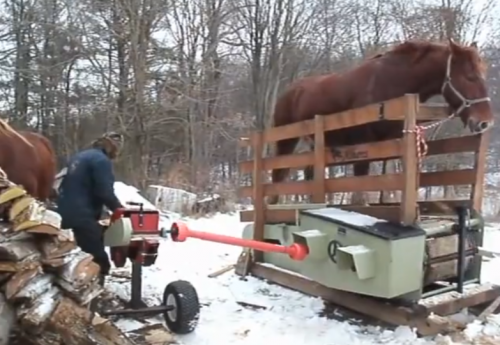 A city slicker is watching a Maine farmer remove some of the previous winter's crop of field stones that arrive every year. As the farmer approaches the road where city slicker is watching from he speaks up. City Slicker: Where did all those rocks come from? Farmer: The glacier brought 'em. City Slicker: Where did the glacier go? Farmer: Back for more rocks.
My brother smoked so many candy cigarettes as a kid, I got secondhand diabetes.
If it belongs to or is of at least this universe, what is it's totality. Can it with enough time be revealed entirely. Is our utilization of it its "true purpose" or are we just using a microscope to break rocks into smaller pieces.
A city slicker is watching a Maine farmer remove some of the previous winter's crop of field stones that arrive every year. As the farmer approaches the road where city slicker is watching from he speaks up. City Slicker: Where did all those rocks come from? Farmer: The glacier brought 'em. City Slicker: Where did the glacier go? Farmer: Back for more rocks.
My brother smoked so many candy cigarettes as a kid, I got secondhand diabetes.
If it belongs to or is of at least this universe, what is it's totality. Can it with enough time be revealed entirely. Is our utilization of it its "true purpose" or are we just using a microscope to break rocks into smaller pieces.


Important Information
We have placed cookies on your device to help make this website better. You can adjust your cookie settings, otherwise we'll assume you're okay to continue.
Account
Search
Configure browser push notifications
Chrome (Android)
- Tap the lock icon next to the address bar.
- Tap Permissions → Notifications.
- Adjust your preference.
Chrome (Desktop)
- Click the padlock icon in the address bar.
- Select Site settings.
- Find Notifications and adjust your preference.
Safari (iOS 16.4+)
- Ensure the site is installed via Add to Home Screen.
- Open Settings App → Notifications.
- Find your app name and adjust your preference.
Safari (macOS)
- Go to Safari → Preferences.
- Click the Websites tab.
- Select Notifications in the sidebar.
- Find this website and adjust your preference.
Edge (Android)
- Tap the lock icon next to the address bar.
- Tap Permissions.
- Find Notifications and adjust your preference.
Edge (Desktop)
- Click the padlock icon in the address bar.
- Click Permissions for this site.
- Find Notifications and adjust your preference.
Firefox (Android)
- Go to Settings → Site permissions.
- Tap Notifications.
- Find this site in the list and adjust your preference.
Firefox (Desktop)
- Open Firefox Settings.
- Search for Notifications.
- Find this site in the list and adjust your preference.