studiot
Senior Members
-
Joined
-
Last visited
Everything posted by studiot
-
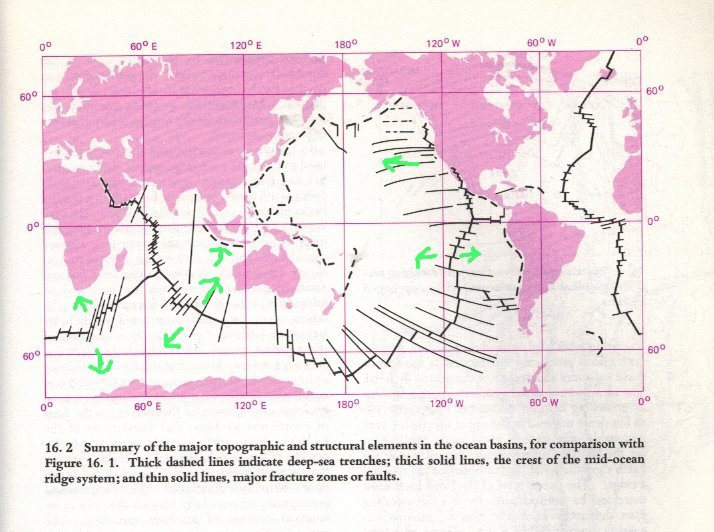
Perhaps you should consider receiving some geological instruction rather than offering personal insults to others. Here is a map of the Pacific 'mid ocean ridge system.' I have marked some of the movements with green arrows. I have paid particular attention to some of the movements you have scoffed at. 1) The ocean ridge between Australia and Antartica is pushing Australia towards Asia in general and indonesia in particular. This shows up as the dashed subduction zone between Australia and Indonesia. 2) The eastern end of the ridge system does indeed generate the Gulf of California and run into it, where mexican California is being separated from mainland North America. 3) A branch runs into the Red Sea, again separating Africa from Asia. 4) The separation of Australia and Antarctica is continud westwards so also separating Africa and Antarctica. This is pushing Africa northwards into Europe, closing the Mediteranean, not opening it. 5) These are current (today's) movements. Some of the plate movements are rotational or transform or both. 6) All the subduction zones are in the right place but some are not current, but historic, so some mountain chains are currently active volcanically, others have show past volcanicity.
-
Thanks for that information. It just shows what an enormous waste of of public money the UK is making in buying at least two new but hopelessly outdated fission reactiors from the French. We never should have abandoned ZETA.
-
Thanks, I really hope your got something out of this because I didn't mention particles once. Yes I did say effects. I am using general English words for your benefit. A quantum effect in a system occurs when some quantity (usually but not always some form of energy) can only occur in certain specific values and not in any other value, even nearby that are only say 0.001% different. These values are called (energy) states. This means that when the system changes energy it can only change by the differences between allowable energy states. Such quantities are said to be quantised for the system. Another quantised quantity is electric charge. None of the rest of your musings have any relevence to anything I said.
-
In another thread you said $100s on book.s I'm sorry to tell you that you wasted your money. Which book did you read that in ? [math]\frac{3}{4}is\;a\;proper\;fraction[/math] [math]\frac{4}{3}is\;an\;improper\;fraction[/math]
-
Sensei's notation does not conform to the nuclear reaction notation I was taught. For instance [math]{}_7^{14}N + {}_0^1n \to {}_6^{14}C + {}_1^1H[/math] Where the upper number refers to the mass number and the lower to the +ve charge number (so reckoned -ve for negative charges) I also agee about the short half lives, carbon-14 has short one in terms of billions of years at just over 5 and a half thousand years.
-
Thank you both again for your contributions. I agree there are interesting connections to computing. This was in part prompted by my family having a large jigsaw map of the world to work on at lockdown Christmas time. Another part of the family had a personalised jigsaw made from a closeup photograph of their family dogs on a grey sofa. Darth Vader black has nothing on fine hair/fur on a grey featureless sofa background. But in invoking the scientific method I was also considering human ingenuity as compared to something a monkey could do, given time. Since neither of you are english, you may not be familiar with the english expression "Brute force and ignorance" as some method 'any fool (or monkey) could employ'.
-
Thank's for the replies. The method appears to be try every combination until correct fit is achieved. Can brute force and ignorance be called 'scientific' ?
-
So can you apply the scientific method to jigsaws and if so, how ?
-
You ned to use somehing like Pilkington Optiview glass https://www.pilkington.com/en/global/products/product-categories/special-applications/pilkington-optiview-range/pilkington-optiview-protect
-
Mmm disappointing response to my question -- you might have learned something. I wasn't aware that Bolzano wrote any engineering textbook - This thread is supposedly about engineering texts.
-
The equation, as written, has zero net charge ( 0 + 0 = 0 ) on the left hand side but + 1 positive charge in the right hand side ( 0 + 1 = +1 )
-
Please check your second equation. The (electric) charges don't balance.
-
Are you ? But +1 anyway. I repeat my observation that this is just a wind up. isaac, I've rumbled your game. So [game] - on The game being [Insert your favourite reptile] - on My favourite reptile is [Komodo drag] - on or perhaps [Pyth] -on Your move I believe.
-
Sure, hope Ghideon's help works out for you. He (or Sensei) should be able to log into your router remotely from the internet. I used to do this all the time to mine. But keep sensitive information to private messages.
-
That was a huge block of text entering into many areas which only have a tenuous connection or none at all. So many questions all at once, I can't tell which are important to you so here are a few thoughts. Phlogiston was not a 'force' theory. You are correct that it takes a finite time for a photon to interact with an atom or electron or for the generation of a photon from an atom or electron. This interaction time does not determine the energy of the interaction in any way. It is related to the energy by the Heisenberg uncertainty principle (HUP). The quantum of energy is determined by environmental factors which set the potential energy levels available to the system. If you can separate out and organise your questions better you will get some better answers.
-
Why can you not log on to the control page of your router ?
-
No. I do not know why I put a dot there, but to my untrained eye it looks neater. You need to consider just the first 3 paragraphs of my post together, and say what you disagree with. I do not have unlimited time to reply to everything. I asked for clarification, I can't agree or disagree as Idon't know what you are talking about So this is a wind up then. Thank you for confirming that and wasting my valuable time.
-
It's while since I needed to setup a router but there used to be a different set of IP addresses, outside of the normal range of local IP usage, for doing this since the computer acts as network controller (DNS server) and the router as slave when you first do this. Once you have done the proper setup, you switch roles on the devices. I also wondered if you had a smartphone with an (unknown or suspected) rogue app.
-
A couple of thoughts. You say you have nothing wifi equipped in your house. Are you quite sure? Even if you have 'disabled' it on the Chromebook, won't it will still be live inside ? Some modern televisions have internal wifi as well as Ethernet connections. Same with printers, scanners, doorbells and other auxiliary devices. Printers with wifi and ethernet are often a pain to get working on the right network. If you have such a printer is the chromebook trying to set itself to the printer's own local network and fighting itself if you want to use the router ? Do you have a 'firestick' or other interface between tv and home network ?
-
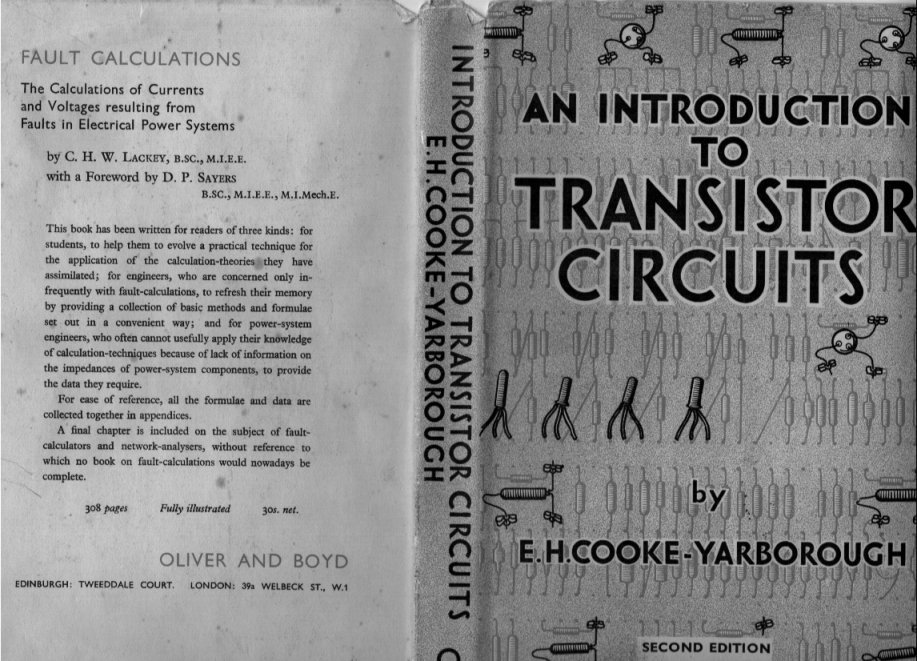
Thanks for the reply, but why do you say this ? Here are the front and back covers of a book from 1957. The front cover is about totally obsolete transistor circuitry. The back cover is an advert for an different book in the series about electrical powerline faults, powerline stuuf is still in date. Another really good example would be "Design of Reinforced Concrete to CP114" CP 114 was the design standard from the late 1940s to the late 1960s when it was replaced by CP110. There is a word of differerence between these standards. CP110 brought in "Limit State Analysis" Are you aware of Limit State Analysis in engineering design ? It is of vital importance in the modern world.
-
Thanks for the attempted help. Unfortunately your link is the same as the OP. Here is what I get, I don't deal with outside sites that do this.

-
I can't access the OP post because it "values my privacy" can we see what it says here please?
-
Surely it's momentum you want not velocity per se. I haven't computed exhaust momenta, have you calculated these for comparison ?
-
This might help How many valency electrons did chenbeier say Br- has ?

-
Just to expand on swansont's words. Can I gently suggest/offer a lesson in basic efficiency Physics? It take some energy once and once only to get a generator mass spinning. Once spinning all you loose (inefficiency) is the frictional loss in the bearings. The greater part of the input mechnaical energy is output as electrical energy. Of course there are also the inefficiencies of converting thermal energy to mechanical energy.