


swansont
-
Posts
52861 -
Joined
-
Last visited
-
Days Won
261
Content Type
Profiles
Forums
Events
Posts posted by swansont
-
-
What I’m putting out to this group is something of a challenge to come up with methods to return the bubble to the base of the column.
I predict it will take more energy to reintroduce the bubble to the column than you can get from the device. You are required to displace that volume of water vertically, and if it's bouyant, the water has more mass.
Perpetual motion violates the laws of thermodynamics, and in this house we obey the laws of thermodynamics.
edit: Perpetual motion. Moved to speculations.
0 -
The Darwin fish requires the Christian fish to provide context. It's not original, which sort of defies the "original thinker" attitude most non-religious people prize. Regardless of intent, it seems to mock.
I think it's meant to mock the fundamentalist-literalists; I wouldn't be surprised if there were a larger correlation of that subset of Christians and those who display the fish symbol.
But if someone has the right to display their affiliation with, well, anything, am I not permitted to be somehow offended by that, and don't I have the right to comment on it?
If you e.g. declare on a bumper sticker that you have an honors student at JoeSchmoe junior high, I can't find the notion silly or offensive, and satirize it? (My kid knocked up/beat up your honor student, sold the test answers to your honor student, my kid was prisoner of the month at the local jail, etc). Can I mock your choice of candidate if I disagree with their policies and actions? How is this any different?
The Darwin fish, to me, is an objection to the narrow-minded literal interpretation of the Bible, which is being presented as truth rather strongly by some, and frankly, I find that behavior offensive. If Christians who don't fall into that category are offended by my attitude or potential response (I don't have a Darwin fish on any of my possessions), consider the possibility that they are assuming too much. Some people get offended because they "know what the instigator actually meant." But I reject the notion that I am responsible for how someone else (mis)interprets my speech. Especially in this case, where they can just turn the other cheek — a phrase I read ... somewhere.
0 -
Okay, I've got some exercises here that I need some help with. I tried to do them, but I always get to a point where I just don't know what to do...
1)
A train is sitting (idle) in front of a tunnel of the length [math]d=320m[/math] so that the trains front is placed exactly at the beginning of the tunnel. When a signal was given, the train started to move. In this instant a person standing at the very end of the train started counting the time. He noted that he entered the tunnel when his watch showed the time [math]t_1=30 s[/math] and exited the tunnel when his watch showed the time [math]t_3=50 s[/math]. The motion of the train was evenly accelerated the whole time.
What is the length [math]l[/math] of the train, and the time [math]t_2[/math] of the exit of the front of the train from the tunnel?
I think I could calculate both on my own, the problem is I don't know how to figure out the acceleration...
What equation do you have that will tell you your position, as a function of time, that includes acceleration in it?
2) A pilots destination lied northward of his current position. He pointed his airplane north, but didn't take into consideration that a southwest wind was blowing. In [math]t_1=60 minutes[/math] he realized that his course had changed due to the wind. So he pointed the planes direct axis to the west and in [math]t_2= 15 minutes[/math] reached his destination. The velocity of the plane in windless conditions is [math]v_1=180 km/h[/math].
What is the distance [math]d[/math] between the starting point and the destination, and the velocity [math]v_2[/math] of the wind?
This I could solve if, again, I knew his velocity. But I don't know how to get to that. It's not that I'm lazy, I've tried...

I'd like to thank anyone and everyone for their help in advance. Please note that both the exercises are translated from Czech, so please excuse any grammatical errors that might appear. Also note that this isn't really homework. It's work that will decide my grade at the end of this semester....
It's still necessary to get you to work it out, though, since it's schoolwork and it will affect your grade.
This is some vector addition. It should help to draw a diagram to set it up; it looks like the wind velocity is constant throughout, and that's one thing you need to find.
0 -
If the universe is expanding, what is it expanding into?
Until now, I always thought it was *space*-time expanding into something. The post above is a new thought for me, space is already there, matter/energy expanding into it.
We aren't expanding into anything.
http://www.astro.ucla.edu/~wright/cosmology_faq.html#XIN
"[T]here is nothing whatsoever that we have measured or can measure that will show us anything about the larger space. Everything that we measure is within the Universe, and we see no edge or boundary or center of expansion."
(emphasis copied from original)
0 -
1910 to 1940. OK. Point taken about the vulcanisms. I have to agree. It looks like vulcanism is one of the influences leading to warming.
Can you explain the mechanism? Not that you have to. Just that I am curious. Your sulphate aerosol graph (b) shows that it is not via sulphate aerosol, since that seems unrelated to the pattern of vulcanism.
Graph b is anthropogenic sources only. So the volcanic forcing graph can still include sulfate aerosols.
0 -
Swansont said :
"And it isn't up to you to be happy or unhappy with data. It is what it is."
If we are not discussing data and its interpretation, we are not discussing science. Good science requires scepticism, and that scepticism must extend to data as well as interpretation. There are thousands of examples in the history of science where false conclusions have been drawn from shakey data. If I cannot challenge data, then I cannot do science.
Your objection was that it gave values "all over the joint"
Swansont said
"I didn't offer this as evidence of anything."
True. But I did. Our argument stems from my view that sunspot activity is a major driver of warming/cooling, and your denial of that view. The graph you posted supports my view.
No, I don't think it does, but that's not the issue at hand.
(emphasis added)"Now, look at the duration: the 1883 peak doesn't subside for eight years."
That is deceptively worded. It does not disappear for that time, but it subsides almost immediately. It very rapidly loses most of its impact. And by 1910, it is down to about 0.5 W/m2. For most of the warming period of 1910 to 1940, vulcanism effect is essentially zero.
YES! Exactly!
Vulcanism = cooler. No vulcanism = warmer !
"down to 0.5 W/m^2" – 0.5 W/m^2 is pretty big compared to the other forcings.
0 -
Perhaps if you'd post the equation for enthalpy it will become more apparent.
Note to all: "HW help" posting rules in effect
0 -
To swansont
I see you are now offering new and quite different graphs to support your case. This is probably a good idea. I was distinctly unhappy with your earlier sulphate graph. Not only did it gives values all over the joint, and have little or no connection with temperature change, but it was also based on limited sampling. It was all Greenland based, and we were required to make the dubious assumption that Greenland represented the globe.
<sigh> Appeal to ridicule. Why is it dubious? Especialy when it is known that the aerosols stay in the atmosphere for years at a time, so that there should be reasonable mixing.
And it isn't up to you to be happy or unhappy with data. It is what it is. Anyway, there is an average level given with the graph, even if it is hard to see.
Anyway, looking at your new graphs.
The sulphate graph. This one shows a very different picture to your Greenland graph. It is a clear increase in cooling influence from sulphate in the air, following a rough exponential curve from 1850 to just before the year 2000.
This graph does not support any special sulphate driven coolings, since there are no specific peaks in sulphide effect. The special cooling that happened just before 1910 is not matched on this graph by any special sulphate coolings. I trust this will convince you?
The warming period of 1910 to 1940 is matched by a continuing increase in the cooling effect of sulphate aerosols according to this graph. Does this convince you that this warming had nothing to do with a reduction in sulphate cooling?
The Greenland graph did not separate out volcanic activity from industrial activity. So looking at the anthropogenic sulfate cooling of this graph will do absolutely nothing to convince me of volcanic forcings.
(section 6.15.1 "In addition to different forcing mechanisms of anthropogenic origin, two natural forcings have also been considered: solar irradiance variations and stratospheric aerosols of volcanic origin.")
I specifically noted the relevant graph as "graph d"
The solar effect graph. You have already stated that such graphs up to about 2005 are obsolete. Your two graphs here are 1995 and 1993, so you cannot refer to them for your arguments. For what it is worth, both show cooling influences to the end of the 19th Century and warming influences from just before 1910. Thus, the solar influence is (by these graphs) a better candidate for a drive of early warmings/coolings than sulphate aerosol. Having said that - yes, there will be other influences also.
Same note as I made above. I didn't offer this as evidence of anything.
The final new graph - volcanoes. Thes show what I have been saying all along. Vulcanism is a short lived influence on global temperature change.
You need to actually look at the graphs — all of it. The scale on the left is in W/m^2. Even though the specific data in the other graphs aren't germane to this particular point, look at the scale: tenths of W/m^2. These volcanic effects are bigger. By an order of magnitude, over similar time scales!
Now, look at the duration: the 1883 peak doesn't subside for eight years. The 1900 peak goes to zero once, and is otherwise present until 1911.
And yes, that's relatively short-lived. That's part of the point! The activity between 1900 and 1910 lowered the temperature during that time. So when you pick 1910 as a starting point, you are cherry-picking your example — it's a lower temperature than it would have been if not for the volcanic activity. The decrease in the levels after that cause the temperature to go up.
0 -
To what "surrounding empty space" do you refer? There is no "outside the universe."
0 -
It's generally tough to visualize 3-D non-Euclidean geometries, so the nomenclature focuses on two of them. Which is pointed out in Jonathan's first link.
0 -
There is just one more things swansont. Today I was reading a script my Richard Muller called "Atoms and Heat" (part of a physics course), and it was there where I read that the average temperature of universe is -270 C, but it also was said that due to expansion of the universe, this average is expected to decrease further. So is there any possibility that absolute zero could be reached in a "natural way"?
Cheers,
Shade
It's the asymptote for infinite expansion after infinite time. You'll never quite get there.
0 -
I don't really think absolute zero will ever be reached!
I think almost everybody who's taken basic physics would agree with you.
you can cool things below ambient easily with lasers. i think swansont does it.Yes, but "simple" laser cooling stop at about a microKelvin (Doppler and then polarization-gradient cooling). The program goes on to even colder states with BEC, which add in evaporative cooling in a magnetic trap to achieve the colder temperatures (nanoKelvin-ish). It looks like all of that material will be on the second program.
0 -
From refrigeration to BECs. Two-part special, scheduled Jan 8th and 15th
http://www.pbs.org/wgbh/nova/zero/index.html
"The two-part special follows the quest for cold from the unlikely father of air-conditioning, the court magician of King James I of England in the 17th century, to today's scientists pioneering superfast computing in the quantum chill near absolute zero"
The second part will be about the more recent advances
Ultracold atom Q&A with Luis Orozco (U. Md, formerly at Stony Brook)
0 -
The fears and conspiracies around things like the flu shot and the various other vaccines strike me as ignorant. I don't know what motivates it, but it seems very misguided and appears to feed off of some strange belief set and lack of rationality.
The risk/reward assessment has been skewed. As the BA pointed out, parents of toddlers these days don't remember people dying from polio and smallpox. The short institutional memory means they underestimate the reward and overestimate the risk. And that's even before you get the woo added in.
0 -
Swansont
I have to conclude either
1. We are looking at different graphs, or
2. You haven't the faintest idea of how to read a graph.
I do not believe the latter, since you are clearly not stupid. However, some of the things you have said about the sulphate graph are just wrong.
The graph I am looking at says :
Around 1880, two peaks reaching a maximum of just under 150ng/g
About 1885 to about 1895, sulphate falling to about 30 ng/g
1895 to about 1905, sulphate rising to about 40 ng/g average
After 1905, rising to a maximum of about 240 ng/g, although with a medium term average of about 75.
The mean level appears to rise from 75 to about 100 by 1950
I've said "mean sulfate level" about a half-dozen times, so I though it would be clear I'm not looking at the spikes, which are of relatively short duration.
But, if you want to look at the peaks, OK. Peak in 1883. What effect does that have on temperature?
Several medium peaks between 1900 and 1910. Large peak around 1903 and another in ~1910. What effect does that have on temperature?
In other words, sulphate aerosol levels by 1910 are large and grow even larger. If they are cooling influences, then why does the temperature rise so dramatically 1910 to 1940?
Sulfate levels are clearly dropping between 1910 and 1935. The claim that the levels grow after 1910 is clearly not true.
What is the mean sulfate level in 1935? (about 50 ng/g)
Is that bigger or smaller than in 1910? (smaller, by about 25 ng/g)
What effect will smaller sulfate levels have on temperature? (it will go up)
You said :
"My claim has been that your starting point of 1910 (for the 1910-1940 warming) comes at the end of some significant cooling from volcanic activity."
The way I read the graph, is that the starting point of 1910 just after the beginning of some significant rise in sulphate aerosol. If sulphate comes from vulcanism, then there must have been a hell of a lot of it from 1910 onwards. And we know that was not true. If we read the sulphate graph from 1910 to 1930, in isolation, without knowing any of the other values, we would conclude that higher sulphate levels caused global warming.
The level is going down in that time span, so I don't see what the problem is here.
SwansontWe might be looking at the same graph, but we sure are not seeing the same graph. What you claim is so tainted by your expectation, that you simply cannot see what is in front of you.
Yeah, me and those other silly scientists who actually do this for a living.
http://www.grida.no/climate/ipcc_tar/wg1/fig6-8.htm (graph d)
0 -
Swansont said
"It took 4 to return to "normal" levels."
There were two years of cooling. You are claiming that 30 years of cooling in 1880 to 1910 had the same cause. Pinatubo was the biggest volcanic event in 100 years, and caused only 2 years of cooling. Your claim that much lower levels of sulphate aerosol release can cause 30 years does not hold water.
No, I am not. It's clear when you paraphrase me that you have not understood my arguments at all. I have never claimed that any forcing is the sole cause of any temperature change — you're the one who keeps phrasing things that way.
My claim has been that your starting point of 1910 (for the 1910-1940 warming) comes at the end of some significant cooling from volcanic activity. You're the one who keeps bringing up the 30-year stretch; I have never claimed that the entire cooling of that time was due to volcanic activity!
To refresh your memory:
Let's take the temperature increase from ~1910-1940 at 0.4 ºC as correct. Now, the CO2 increase then was "trivial" but how much is that? Half of the recent increase? A third? Because that still gives an increase of ~0.15 - 0.2 ºC as being due to CO2 (0.15 - 0.2 ºC per decade, three decades, and take a third of that). And, as we've discussed before, ~1910 represents the end of some high volcano activity, which had caused significant cooling. So what does that contribute? 0.1 - 0.2 ºC? The combination of those two take up more than half of the observed increase.See! I claimed that the decrease in volcanic activity caused 0.1 - 0.2 ºC of cooling and subsequent warming. The cooling from 1880-1910 was almost 0.4 ºC.
You said
"There is a very large change in the sulfate levels around 1900-1910, then they drop off. I don't see how you can look at the graph and deny that."
There is a very important principle that goes : "Everything is relative."
So let me rephrase your statement.
"Relative to the degree of change in aerosol level over the entire graph, there is a very small, almost trivial, increase in sulphate levels around 1900 - 1910, then they drop off."
No, as I stated before, the sulfate level rises from around 25 to around 75, with the bulk of that occurring between 1900 and 1910. Compare this to the mean level at around 1970, where the average is between 100 and 125 (looks to be ~110).
You have to quantify these things. The use of adjectives is a poor way to analyze things, especially when you do it incorrectly. An increase from 25 to 75 is certainly not small or trivial. It's comparable to the increase from 1940 to 1970.
You are making very big claims for a very small change. As I said, you are stretching. The increase in aerosols around 1910 is massive compared to this trivial change. If your principle is correct, then there should be a massive cooling from 1910 on. Instead we get the second greatest warming in the last 100 years. As the great robot said : "This does not compute!"
The increase in aerosols around 1900-1910 (and the subsequent decrease) is what I'm talking about! Why do you think there should be massive cooling after 1910, since that's around when the sulfate levels start falling? I'm certainly not making that claim.
"Yes the peak is larger, but then so was the cooling. As your source pointed out, Tambora caused 3 ºC of cooling. How big does the peak need to be to cause, say, 10% of that amount of cooling?"
The degree of cooling is not the point. It is the period of cooling that matters. Tambora caused a cooling of 12 months. You are claiming minimal increase in aerosols causing a cooling of 30 years, whereas much larger increases in aerosols are associated with the warming from 1910 on. Can you not see the problems here?
(emphasis added)
The mind boggles, again. The degree of cooling is not the point? It's exactly the point! If Tambora cause 3 ºC of cooling for sulfate levels that spiked to 275 (and were not sustained to that level), what level of cooling will you get for a sustained increase from 25 to 50? You seem to be claiming that it can't be as large as a few tenths of a degree, yet that's what the proportions are — it's one-tenth of the increase.
0 -
First. Your references to Mt. Pinatubo. The world cooled for 2 years, and then was warming again. Warming began after less than 2 years according to your own reference. And this was for the largest volcanic event of the 20th Century.
It took 4 to return to "normal" levels.
before, you said
High levels of sulphate are supposed to cause cooling.So using this definition, there were ~4 years of cooling, since the sulfate levels were high. Using another definition, it cooled for 2 years and warmed for 2, all the while being cooler than would have otherwise occurred. Doesn't really matter which one you use, but use it consistently.
Second : Your aerosols of 1880 to 1910. For most of that cooling period, aerosols were at a low level - way less than the average level for the 20th century. There were a couple of medium and quite unexceptional peaks around 1880, and then nothing till after 1905.
That's not a valid comparison unless you know how much cooling happened later in the 20th century! Even so, the change from 1880-1910 is larger (both in absolute and especially in relative terms) than the change from 1910 to present.
There is a very large change in the sulfate levels around 1900-1910, then they drop off. I don't see how you can look at the graph and deny that.
On the other hand, aerosol peaks were very high around 1910, which was when the second biggest warming event of the 20th Century began. The suggestion that cooling is caused by aerosols is counter-indicated by these figures.
And as you pointed out with Pinatubo, if you get cooling from elevated sulfate levels, you should get warming as they subside. Either it happens this way or it doesn't.
It is interesting to see the very large peak around 1815, which probably relates to the eruption of Mt. Tambora, and which caused a major cooling lasting 12 months. This peak is larger by far than any until after 1990. It makes the peaks you refer to look tiny.
Yes the peak is larger, but then so was the cooling. As your source pointed out, Tambora caused 3 ºC of cooling. How big does the peak need to be to cause, say, 10% of that amount of cooling?
0 -
and i had the MMR jab with the mercury in it, so did everybody at my school both primary and highschool. there was nobody who had autism. 1600 different people there.
if there is a link its a tenuous one at best. a little bit of mercury once won't do much. its a cumulative poison need a decent amount over a period of time to make it affect you.
Especially since removing mercury (thimerosal) didn't reduce the number of new autism diagnoses in the US.
0 -
One thing I noticed before I was diagnosed was that certain foods, like pizza (exacerbated by eating too much of it), induced the urination/thirst cycle more than others.
0 -
Using the phrase "very logical" to the BB? Once upon a time(whoops, sorry there was no time) a singularity(what's a singularity?) started to expand (why?) and gave off all this cmbr, so now that we know what was happening in the first trillionth second? But instead of expanding like a big ballon should we have all this acceleration and light shifting happening? Yeah, my bad, I can see all the good logic there.
Appeal to ridicule.
The CBR wasn't always microwave (it wasn't "given off" as cmbr), and it's thermalized because of all the photon scattering that occurred in the early universe before it was cool enough for the electrons to combine with protons (and deuterons, etc) and form neutral atoms.
You don't appear to understand the topic you're criticizing. Nature is under no obligation to be understandable and follow your brand of logic.
0 -
Oohhh... Where's THAT forum? I want to post my questions THERE!


Subscriber-only. Got a credit card?
 0
0 -
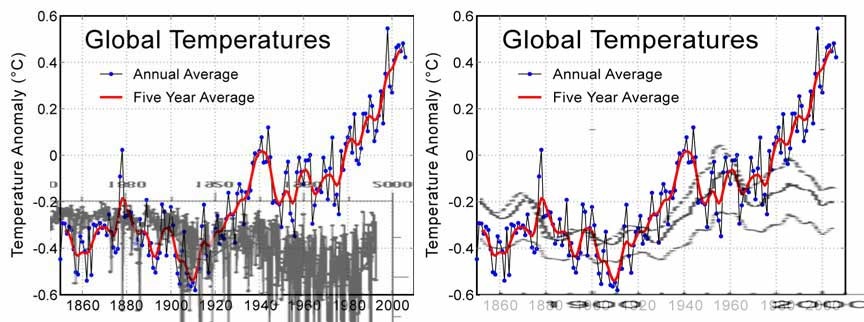
Just for fun I superimposed the sulfate levels on the temperature graph (inverted because of the negative impact). Pretty good matchup of the big temperature drop around 1900-1910, and also how (presumably predominantly industrial) sulfates look to have had an impact after 1940, where the temperature dropped and then showed little increase.
Also, I overlayed the Solanki 2007 TSI graph. Notice how the only real significant correlation is around 1880, where temperature lags the solar decline by a few years. Then it's basically flat, while temperature continues to fall. The relatively large TSI rise that occurs later does not begin until 1930, lagging the temperature rise by 20 years, and so the temperature rise starting in 1910 cannot be caused by solar variation.
 0
0 -
mod note: Posts removed
Don't give the answers, folks. This is HW Help, not Do-my-HW-for-me.
0 -
The biggest objection to my theory is that the cmbr is isotropic and does not come from one source. After reading my post I can see the confusion. I do not mean the cmbr is all being radiated presently. I do believe after billions of years and billions of star births, and billions of star novas, and untold quasars, and everything else out there (all isotropic of course) that cosmic background radiation would be a given. Believing it came from one source is illogical.
It doesn't matter what you "believe." By what mechanism would galactic sources give rise to a nearly isotropic background? What does it scatter off of? The distribution of matter is quite clearly not uniform. Why would it have the temperature that is observed?
Argument from incredulity carries no weight as an argument.
0
The environmental debate thread
in Climate Science
Posted
I didn't claim that vulcanism was the cause of warming through 1940. I claimed that it caused the cooling around 1900-1910 (of around 0.2 ºC), and the subsequent return to previous levels was due to the return of vulcanism to much lower levels. CO2 accounted for perhaps 0.1 ºC of the warming during that whole span from 1900-1940. Possibly less, and probably not much more.
Which means that solar could not be reponsible for 0.4 ºC of warming during that period, and that was the claim to which I was objecting.
Other factors would be a combination of other GHGs, changes in surface albedo, ozone. Small individually, AFAIK, so we've ignored them.
It's been noted that we are currently not in equilibrium; if CO2 were to magically stabilize the earth would continue to warm several tenths of a degree. I don't know what the equilibrium status was back then, but it's not accurate to say that you need changing conditions to see a temperature change — it depends on what the time constant of the system is.
It's in the main body, as I noted in post #202
section 6.15.1 "In addition to different forcing mechanisms of anthropogenic origin, two natural forcings have also been considered: solar irradiance variations and stratospheric aerosols of volcanic origin."
Which means that graphs a and b are anthropogenic sources.
You don't see the peaks in graph d of the IPCC report replicated in the Greenland data? I see the peaks in 1810, 1815, 1830, 1883, 1902 and 1910.