


swansont
-
Posts
52861 -
Joined
-
Last visited
-
Days Won
261
Content Type
Profiles
Forums
Events
Posts posted by swansont
-
-
You can get dew (water condensing on a surface) indoors — it happens a lot if you run the shower; relative humidity and dewpoint temperature are related to each other. And when the surface has a high heat conductivity and heat capacity, you can remove the latent heat quite readily.
But that doesn't mean that's what is going on here. It probably isn't.
The presence of water at the tips but not the rest of the stalk suggests it's not dew (or not entirely dew). I suspect it's biology and not physics.
<pause to Google>
AHA!: Guttation
http://en.wikipedia.org/wiki/Guttation
http://sparkleberrysprings.com/v-web/b2/?p=526
Learned something new!

(technically there is some physics going on with the capillary action drawing the water up, etc. but it's still biology overall)
0 -
swansont
Also, your model predicts many particles that have not been observed. An explanation of how to observe these particles would be in order.
I have written a short article with a long table (58 pages) showing how Electron Binding Energies can be used to demonstrate that the number of shell particle states found within atomic structure far exceeds the number of leptons listed by the Particle Data Group.
And you don't see it as a problem that you predict particle states that nobody has observed? Shouldn't we readily see evidence of these states in atomic spectra? If not, how do you transition between the states without emitting photons, and how would one observe these states?
0 -
To swansont
Nice graphs.
I am not sure how this quite relates to temperature change. Just from a visual comparison between the TSI figures as shown on your second graph, and average global temperature change, there appears to be a very good statistical correlation (not perfect - by what is?). Did the researchers attempt to relate the TSI levels to global temperature? Some kind of conversion formula?
I didn't see any temperature plots; the axes here are TSI, which was one of the axes in the plots from the other paper. You should be able to directly compare them.
Since the TSI increase in the recent plots post-date the early/mid-century temperature increase by ~20 years (1930-1960 vs 1910-1940, i.e. almost two full sunspot cycles), I have a hard time accepting a characterization that the correlation is "good." The solar increase should precede the temperature increase it's causing, right? I suspect that's why the authors didn't present that correlation. If they said anything I missed it in scanning over the paper.
They admit that the previous analysis was too large, and this analysis agrees with other independent work. Energy should correlate with temperature; if the TSI change was half of the previous study (and it's actually less), it stands to reason that the associated temperature increase is similarly smaller, which puts it pretty much in agreement with all the other studies.
0 -
forgot to add:
The last line of their conclusion is
"The (delta)TSI obtained in this paper thus cover the range found
from independent recent reconstructions. However, all the values
we obtain are significantly below the (delta)TSI values deduced
from stellar data and used in older TSI reconstructions."
edit: (delta symbol didn't paste properly from the pdf; added text)
0 -
Swansont asked
"- do you mean sunspot number, or something else?"
My main reference on the relationship between sunspot activity and temperature is the Max Plank Institute who published their data from 1860 to 2000. Their data shows a really nic correlation from 1860 to about 1970. After that, it all falls apart.
They used a term 'reconstructed irradiance' which is a blend of sunspot number, sunspot area, and the intensity of sunspot action. This shows a clear correlation with temperature change.
One of their papers is at :
I quote :
"As the scientists have reported in the renowned scientific journal, Physical Review Letters, since 1940 the mean sunspot number is higher than it has ever been in the last thousand years and two and a half times higher than the long term average."
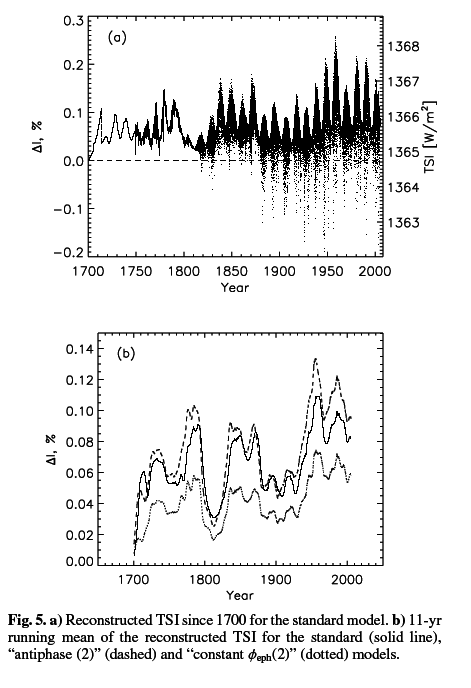
I downloaded the first paper and as you've posted before, there are the graphs showing a variation in TSI of about 2.5 W/m^2. Then I noticed that a newer paper is out. Lo and behold, the variation has decreased by more than a factor of two. (I couldn't copy and paste a link, but pdfs are available. I searched on Google scholar and found a preprint)
Reconstruction of solar total irradiance since 1700 from the surface magnetic flux N.A. Krivova, L. Balmaceda, and S.K. Solanki
Astronomy & Astrophysics (2007)
Note that the 0.1% is shown in the first graph as being about 1.25 W/m^2, and the 1930-1960 variation is less than that, no matter which of their models you use, and there is a shift in the dates of the peaks and troughs. The correlation doesn't look as good now, I think.
There are other TSI reconstructions in the paper, but they aren't very different.
 0
0 -
The quote is basically as I described it above. It's an idealization of no external influences.
As an example with which I am quite familiar, the second is defined as 9192631770 oscillations of the hyperfine states of an isolated cesium-133 atom. That's because collisions and stray electric and magnetic fields will all give rise to errors because they change the frequency.
So you define it for an isolated atom, and then try and quantify all of the perturbations (collision shift, Stark shift and Zeeman shift from the three examples I gave)
1 -
It may just be referring to an atom that is not interacting with any other atoms, fields or other particles (e.g. photons)
0 -
"since ultimately it's the energy that reaches us that directly affects temperature.)"
One of the theories of the mechanism by which sunspot activity affects global temperature is by the indirect route of ..
High sunspot activity means high solar magnetic activity
This affects the magnetic field around Earth (not a theory - it has been measured)
This diverts cosmic rays away from Earth (also confirmed by direct measurement)
This reduces ions that act as nucleation points for water vapour
This reduces cloud cover
This reduces Earth's albedo
This causes warming
Some satellite studies have shown that cloud cover drops during periods of high sunspot activity, which fits this theory.
The point is that, if this theory is correct, then the effect of high sunspot activity is not dependent on direct energy transfer - sun to Earth. Of course, it is only a theory, and there are other theories also.
And these would be indirect effects.
However, it's hard to keep all this clear when you use the terms interchangeably. This has come up before - do you mean sunspot number, or something else?
"this requires a quantitative analysis which you haven't provided or cited."It would be nice to do so. However, as I pointed out, if we don't understand the mechanism, how can we calculate the forcing? The closest we can get to is a description of the correlation between sunspot activity and temperature change. This has been described many times.
Correlation tells you nothing when the correlation isn't always present.
http://en.wikipedia.org/wiki/Image:Temp-sunspot-co2.svg
Sunspot number drops dramatically near 1880 while temperature is rising. Sunspot number peaks in 1960, but cooling begins in 1940.
If we go back further, there are huge spans where sunspot number and temperature anti-correlate
http://en.wikipedia.org/wiki/Image:Sunspot-temperature-10000yr.svg
What this indicates to me is that the correlations you see are coincidental and not causal.
"Let's take the temperature increase from ~1910-1940 at 0.4 ºC as correct. Now, the CO2 increase then was "trivial" but how much is that? "
Actually, about 10% of recent increases. 1870 to 1940 saw an increase in CO2 of approx 290 ppm to 303. Less than 0.2 ppm per year. The last 30 years, it has been a bit under 2 ppm per year.
1880 to 1910 was cooling. That may have been influenced by vulcanism, but also included a drop in sunspot activity. 1910 to 1940 was a period of trivial greenhouse gas increase, but substantial warming - almost as much as recent warming, and 'coincided' with the largest increase in sunspot activity for a thousand years.
But as you have previously noted, the response to temperature is not linear — it's logarithmic.
If you assess the recent temperaure increase as being due to CO2 (380 ppm vs 335 ppm (taken from http://www.omgfilms.com/spark1/images/stories/fruit/mauna_loa_carbon_dioxide.png ) corresponding to a temperature increase of 0.5 ºC, then a rise from 290 to 303 ppm (you didn't say where you got the numbers) corresponds to a 0.175 ºC increase in temperature.
And 1880-1910 saw ~flat average sunspot number. You'll have to show what graphs you are using.
Similarly the Mann study.. which McIntyre citiqued, and the critique was published in a peer review journal. Am I supposed to assume that a non-peer reviewed rebuttal is sufficient from a site for which Mann is a primary contributor?I pointed out three critiques (which I found after a very quick search), two in GPL and one elsewhere, and got links for two of them.
This is in line with my previous claims as to the questionable methods of debate used at Realclimate.org.The debating methods used elsewhere aren't pertinent to this discussion. If you have a problem with the way they discuss things, take it up with them.
I'm not going to address the rest — I've already noted that it's off topic. How you want to interpret realclimate's use of "stupid" ISN"T RELEVANT.
0 -
You mention the business of noise. I agree with you. I have always been a bit bemused by the signal to noise ratio problem in building up good data on long term climate changes. Take temperature. We have an average warming of 0.018 C per year (plus or minus a titch). This is the signal. The noise is overwhelming. If you take annual temperature difference, from the hottest place and time to the coldest, we have a range of well over 100 C. To extract a meaningful signal from all this noise is not easy.
The temperature difference between locations isn't the source of the noise, though. The noise is because any given location can be hotter or cooler in any year because of local weather conditions. Which means that short-scale deviations between model and data that are below the noise threshold aren't statistically significant.
"If "scientists do not yet understand how sunspot activity changes global temperature" (a statement with which I do not agree), how can you state that the 0.4 ºC increase from 1910 to 1940 was due to sunspots?"This is the difference between theory and empirical data. I am saying that theory lags behind data. It is very clear that major historic temperature changes are correlated with sunspot activity change. This is not even in dispute. Even the IPCC agrees. When sunspot activity increases, and this is followed by temperature increase, at a time when other factors such as greenhouse gases and aerosols etc cannot explain the warming, the conclusion is not hard to draw.
As far as the 0.4 C warming between 1910 and 1940 is concerned, this is associated with a trivial greenhouse gas increase (less than 1 ppm per decade of CO2). But it followed a major increase in sunspot activity. In addition, the 30 years prior also saw the same greenhouse gas increase associated with a cooling. That cooling was preceded by a drop in sunspot activity.
One of the reasons I concentrate on the last 30 years in discussing global warming is that earlier warmings may have been a 'return to normal' following the Little Ice Age. This means that those warmings are not anthropogenic global warming at all.
The Medieval Climate Optimum of 900 AD to 1200 AD was correlated with high sunspot activity. The cooling that followed, leading into the Little Ice Age was correlated with a drop in sunspot activity. And the warming leading up to 1940 was correlated with an increase in sunspot activity.
The action of sunspots and their association with warming and cooling is not really in dispute. Even during the last 30 years there are temperature fluctuations which 'coincide' with highs and lows in the sunspot cycle. It is really only the last 50 years that the broad pattern has been disrupted, and the first 20 years of that period was a net cooling, and thus cannot be described as anthropogenic global warming. Only the last 30 years is clear cut AGW.
No the activity is not in dispute (though the terminology used is often "solar activity" or "solar irradiance" vs "sunspot activity" since ultimately it's the energy that reaches us that directly affects temperature.)
What I'm disputing is the quantitative conclusion — how much of an effect there is. You objected to the solar forcing term as being too small in one model, and this requires a quantitative analysis which you haven't provided or cited.
Let's take the temperature increase from ~1910-1940 at 0.4 ºC as correct. Now, the CO2 increase then was "trivial" but how much is that? Half of the recent increase? A third? Because that still gives an increase of ~0.15 - 0.2 ºC as being due to CO2 (0.15 - 0.2 ºC per decade, three decades, and take a third of that). And, as we've discussed before, ~1910 represents the end of some high volcano activity, which had caused significant cooling. So what does that contribute? 0.1 - 0.2 ºC? The combination of those two take up more than half of the observed increase.
So how can you conclude that the solar forcing term is wrong?
An example of what I WAS saying, and not what you misrepresented me as saying, can be seen here.While a supposed professional climate scientist calling another fellow climate scientist "stupid", among other things, is out of line in a study review... it does shed light on where you picked up your debate style.
You can read a very interesting observation of this childish realclimate article here.
I searched the realclimate entry, and the only two instances of "stupid" occur here:
"Prelude: It's the physics, stupid
…which of course is a paraphrase of Bill Clinton's famous quote regarding the economy. We put the last word in small letters since we've learned that it is not a good debating technique to imply (even inadvertently) that those who are having trouble seeing the force of our arguments might be stupid."
So where, exactly, is a "fellow climate scientist" being called "stupid?"
I also can't help but note two other things:
(1) The climateaudit link does not accurately reproduce the above quote, and (more importantly)
(2) This has absolutely nothing at all to do with the science invloved. It's a diversion. It's inappropriate.
————
TO ALL
Dial it back, folks. The red-herrings and ad-homs (as above), the other fallacious statements and sniping. There's no need to claim misrepresentation or add name-calling. Correct it with out the ugly window dressing, please. No, not please. Just do it.
———
As to the use of "opinion." The way I use it, if it has a scientific backing, it's not opinion. Justify your claims; primary references preferred, or at least something with a written summary that contains the topic at hand — I assume I am not alone in not wanting to have to read a link within a link within a link and sort through the intervening junk to get the point.
Conversely, claiming that a conclusion of a scientific paper is "opinion" doesn't fly. If you think the conclusion is unjustified, point out the flaws in reaching it.
0 -
I'm still catching up, too.
Yes, I agreed that the net cooling of 1940 to 1976 actually happened by 1950. That is off my point, though. The point I was making is that there was a temperature change (net cooling) which did not fit the forcings in the graph. The overall pattern of 1940 to 1976 is that of several coolings and warmings, which do NOT follow that predicted by greenhouse gases.
Neither did it follow that predicted by sulphate aerosol. Nor that predicted by aerosol and greenhouse gases together. To explain the pattern, it is necessary to include a powerful sunspot effect also. And the calculated solar forcings do not do this.
The problem with focusing on any short interval is that random fluctuations will dominate. The differences are about 0.1 ºC, and most of the trends and inflections are actually represented there. The question becomes, what is the stated precision on the model, and how much weather noise is there? I seem to recall that the noise term in Hansen's 1988 paper was supposed to be about 0.1 ºC (links to paper and analysis here ) and I imagine the model from the graph in question would be similar.
As I have argued before, scientists do not yet understand how sunspot activity changes global temperature, in spite of several theories. Until we understand the process, how the hell can we calculate it?
If you do not believe me, take another look at the graph of solar forcings. The biggest increase in sunspot activity, which drove a 0.4 C warming at a time when greenhouse gas increase was trivial, occurred from 1910 to 1940. Does the red line of solar forcings show this? No. It shows a trivial and short lived increase only. Why? Because the whole thing is not understood well enough to permit accurate calculations.
And to come to a final conclusion, if we do not understand something as powerful as sunspot forcings, and cannot calculate them, how can we make accurate predictions for the future?
If "scientists do not yet understand how sunspot activity changes global temperature" (a statement with which I do not agree), how can you state that the 0.4 ºC increase from 1910 to 1940 was due to sunspots?
0 -
Pepper floats on the surface of the water due to the surface tension. Detergent reduces the surface tension. The ripple from the spreading detergent moves the pepper out of the way — if you were to add pepper to the area with detergent, or waited longer for some more mixing, you'd get some pepper falling to the bottom of the bowl.
0 -
No one has been able to prove the existence of ether, and I certainly do not claim to be able to prove it. I guess to do experiments on it you would need to find a place where there wasn't any, if indeed there is some anywhere. This is an abstract idea intended only to get people to acknowledge that there is indeed evidence of the existence of things, and facts that no one understands. cmartin
But you did ...
The fact that matter stays together proves the existence of ether, or some other kind of medium.(emphasis added)
If an ether exists, it should have properties. Figure out what they are, and test. The ether of the 19th century was disproven.
The existence of atoms doesn't raise these questions, since atomic theory is well-founded and pretty well understood.
0 -
I explain why the Big Bang happened which is not yet done.
What does IMO mean ?
IMO = "In My Opinion"
0 -
"the theory starts from the assumption that God has a 50/50 chance of existing"
GIGO
0 -
How I live shares the wealth of my success with many people. There are all those people that build my fossil fuel consuming recreational vehicles, those that distribute and sell them, those that produce the fossil fuels and those that distribute it. Then there are those that sell me breakfast, lunch, and dinner when I am away from home in the mountains enjoying nature and my friends. It's called the economy. Maybe you have heard of it.
My way sound much more generous than shutting down the economy based on articles published in research paper mills. I guess those people have to work too. Perhaps you think people would be better off if the wealth of the world were put into dumping iron oxide into the oceans to increase the number of little crustaceans. I know, maybe we could turn corn into alcohol and drive up food prices. That just might improve man kind’s lot.
Economics and politics don't belong in this discussion — that can be debated in another thread. Restrict it to the science, please.
Re:"Stephen McIntyre and Ross McKitrick have become famous (or infamous) for claiming to have found major problems with a recent reconstruction of the past climate (called the Hockey Stick because of the shape). Even though major and glaring errors have been found in their writings, they continue to be favorites with the global warming "skeptics." " You won't of course mind providing peer reviewed articles to back this up?Are you asking for a peer-reviewed article that directly rebuts McIntyre and McKitrick's critiques? (not sure of the context of your last sentence) AFAIK the bulk of their work does not appear in peer-reviewed journals. If they are not, then it doesn't require a peer-reviewed rebuttal. Such an article likely wouldn't get published if the original article did not appear in a journal. Articles that link to peer-reviewed research should suffice in that case.
As far as their 2005 paper in GRL, there were rebuttals in that journal: von Storch and Zorita, and Huybers (pdf). And also this article in Journal of Climate
("Energy and Environment" is not generally considered a peer-reviewed source; it's not listed by the ISI)
0 -
I disagree. While the current discussion evolves around petty local minutiae such as urban heat islands and high altitude glacial retreat, I am down in the trenches pumping out the big numbers that matter, the grand scheme of things, the whole enchiladas.

We're discussing anthropogenic greenhouse gases. Your quote concerned itself with natural sources.
0 -
Note how the net cooling of 1940 to 1976 is not explained by that graph.
You've agreed that this is incorrect:
I have no argument with your statement about the 1941 to 1976 period. Sure, the cooling all happened between 1941 and 1950.Use of the statement "net cooling of 1940 to 1976" is a strawman based on cherry-picking data (since 1940 was very near the peak temperature.) The cooling period was much shorter.
Some interesting numbers here, also, though it still adds up to pollution in the end."Carbon dioxide is released to the atmosphere by a variety of natural sources, and over 95% percent of total CO2 emissions would occur even if humans were not present on Earth. For example, the natural decay of organic material in forests and grasslands, such as dead trees, results in the release of about 220 gigatonnes of carbon dioxide every year. This carbon dioxide alone is over 8 times the amount emitted by humans."
http://en.wikipedia.org/wiki/Carbon_dioxide_in_the_Earth's_atmosphere
You do realize that this completely irrelevant to the discussion, right?
As for the rest of it, it is my opinion. I could link you back to the post if you like.. but I fail to see the point in that.
Opinions don't belong here; this is a thread for discussing science. If you have opinions to share, open a thread in politics or general discussion.
0 -
Cool. I remember a class years ago where the teacher exposed some polaroid film with radioactive sources, and then took a picture, and we saw the exposure from the radiation. But do-it-yourself is cooler than a store-bought apparatus.
0 -
What happens to the space twins clock and calender ? Do they just jump ahead? What happens to acts of the space twin that can effect the earth twins present are they just rewritten in his history?
The two flip through their calendars at different rates — they will disagree on the date and time. Nothing to do with rewriting history — they will agree on what happened, just not when it did.
0 -
Is there anything I've missed:doh:!
The calculation seems fine, but the unanswered question is "what does this mean?"
The question is worded awkwardly, since an object doesn't "have" power. That's the power gravity is generating by acting on the object. But if you tried to do work with the object, the power would change quite rapidly.
P=Fv is more useful when the system is under load and moving at constant speed.
0 -
So, can u tell me what is smaller infinite and what is larger infinite? LOL. U have created these ones also. Don't mind at the way of my talking but u r saying absolute nonsense.
Look, the creaton takes some time. And infinite creation is possible in infinite time not in finite time.
There are different "sized" infinities. That is, there are infinite sets that are demonstrably larger than other infinite sets. Claiming otherwise, especially with an appeal to ridicule fallacy thrown in, does nothing to enhance your credibility.
http://en.wikipedia.org/wiki/Aleph_number
You haven't shown that you've created infinite universes — that requires an infinite number of decisions. You also haven't shown that "too many" is actually infinite. "Too many" hasn't been defined, much less rigorously defined.
And also, please do not use "texting" shorthand (e.g. U R ). This isn't a chat room.
0 -
WorldNetDaily is not a valid scientific source. Got any peer-reviewed articles?
0 -
no, because beryllium 8 does not undergo alpha decay.
an alpha particle has to have 2 neutrons and beryllium 8 would be the only one able to to eject 2 alphas without any excess neutrons and such.
Be-8 splits into two alphas in very short order. It's one of the rare even-even nuclei on/near the line of stability that's not stable, since alphas are so tightly bound.
The other nearby unstable Be isotopes beta decay.
0 -
The Mann model of 1998 comes to mind as a model that is poorly designed (the famous "hockey stick"). It has been shown that his normalization methods are such that his model will return a hockey stick graph even with random data.
It is also troubling to me to see an overlay of "proxy data" models that only seem to coincide when the average global temperature is fairly well determined, but vary dramatically when projected into the past.
Furthermore, as I read these studies on current and furture warming, the often used "urbanization" adjustment also is fairly troubling. I wish that I could find the studies that I used in a previous debate, but in one study there was a calculation for "urbanization" with regard to global temperature, and a second follow-up study that barrowed the urbanization calculation, but had to adjust it because the barrowed calculation would have resulted in "cooler than expected" measurements. So in essence they changed the calculation to produce warmer readings. That just struck me as odd at the very least.
Finally, for now, it bothers me that from theory to collection to evaluation many studies seem to be done "in house" rather than using a double blind methodology to evaluate data correlations. There was a study done some time ago where it was shown that even absent direct manipulation of data, statisticians have a 75% chance of supporting a correlation when they know the expected result, whereas it is fairly even when the expected result is unknown. This is why the medical field requires double blind studies when producing medication. It would seem even more important to conduct double blind studies in a field where their is a "consensus" in the exptected outcome.
I have little doubt that the Earth has gone through a warming trend, I am less convinced of the scale, and even less convinced of the abnormality of the current increase in forcings, or the warming trend for that matter.
We can take politics out of the discussion all we want, but the simple fact remains that a huge amount money and political capital has been and will be spent on what is currently seen as an oncoming anthropogenic catastrophe. In that light, I would like the information to at least be accurate.
Also, a warming trend of the last 30 years in not entirely accurate, as for the last 6 years the temperature has remained fairly stable. Claiming thirty years of warming is like me claiming that the Washington Redskins have been a Superbowl calibre football team for the last 30 years... even though that stopped being the case in 1991.
Many claims, and not a single citation. Learn from the examples of others here: make a claim, back it up.
0
The environmental debate thread
in Climate Science
Posted
The TSI drop is almost entirely from 1870-1880, when the temperature was increasing (1879 was a local maximum). So there is an anti-correlation occurring here. From then until 1930 TSI is essentially flat — the fluctuations are of order 0.01% of TSI. If you accept the previous work of these authors (well, two of them anyway) then this causes temperature fluctuations of a few hundredths of a degree. So there is temperature change — in both directions, of a few tenths of a degree — with essentially no solar variation.
Then the TSI rises starting in 1930 — not 1910 — and it climbs steadily until 1960 — not 1950. There is no good correlation here. The graphs don't support your claim.
If you think there is a delay when the solar variation occurs to when the temperature changes, you have to explain why the temperature change lags the TSI change by ~10 years in 1870-1880, and why it precedes the TSI change when temperature begins increasing in 1910.
If TSI changes have a significant influence, then there must have been much larger changes in other factors to account for the non- or anti-corrleations from 1880-1930 and 1940-1950. Meaning TSI changes have to be a smaller contributor. This is what the scientists reporting this have been claiming and what several of us here have been arguing.