


swansont
-
Posts
52803 -
Joined
-
Last visited
-
Days Won
260
Content Type
Profiles
Forums
Events
Posts posted by swansont
-
-
Doesn't the consistency of c fall out of a lot of theories(as in predictions)? Wouldn't variance in c cause Relativity(one of the most accurately tested theories) to fall apart?
Relativity as well as electrodynamics, since constant c shows up there, too. Tha fact that your radio works while you move in your car is evidence that c is currently unchanging.
0 -
I'm guessing This Foxtrot cartoon
0 -
Ranting can be teaching if it makes you think.
Reminds me of a Doonesbury from ages ago. (paraphrased from http://www.motherjones.com/news/feature/1994/09/loeb.html)
A rumpled professor holds forth from a lectern while his students dutifully scribble away in their notepads: " . . . and in my view, Jefferson's defense of these basic rights lacked conviction. Okay, any discussion of what I've covered so far?"
"Of course not," he thinks to himself. "You're too busy getting it all down."
"Let me just add," he goes on, "that personally I believe the Bill of Rights to be a silly, inconsequential recapitulation of truths already found in the Constitution. Any comment?"
The students continue to take notes.
"No, scratch that!" he says, raising his voice and waving his hands. (the students busily scratch out their previous notes) "The Constitution itself should never have been ratified! It's a dangerous document! All power should rest with the executive! What do you think of that?"
They keep writing, their faces blank.
"JEFFERSON WAS THE ANTICHRIST!" the professor screams. "DEMOCRACY IS FASCISM! BLACK IS WHITE! NIGHT IS DAY!"
The students are still taking notes as the professor collapses on the podium, thinking, "Teaching is dead."
"Boy, this course is really getting interesting," one student says.
"You said it," another responds. "I didn't know half this stuff."
0 -
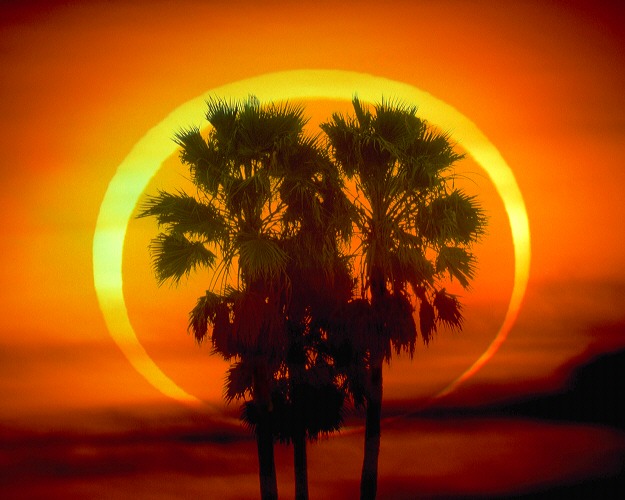
Another wonderful coincidence with our moon. Does anyone know what the odds are that, assuming one moon, that moon would have exactly the apparent diameter to exactly cover the sun during eclipses - to the extent that astronomers can see the sun's corona flaring all around the outside of the moon?
The moon has been receding from the earth, though, so this is something that has not always been true. The coincidence is the right size and orbit but that also includes having sentient beings alive at the right time. Some current eclipses do not cover the sun to that extent — you can get an annular eclipse when the moon is near apogee. Total eclipses will become less common over time and will cease in a few tens or hundreds of millions of years.
0 -
I'm about 50/50 with this theory. I do agree we are quite limited with the view hubble gave us. The photo with every small smudge of light is a galaxy truely says words about how big the universe is. But that is indeed how far we are limited to seeing (any telescope). So if we looked beyond that we would of course see many more galaxies.
I think CPL Luke was referring to the Hubble sphere, which basically translates as the currently observable universe, rather than photos from the satellite telescope.
0 -
I suppose one could ask Farsight to define all of his terms without any circular/self-reference. Just for the irony.
0 -
Whereas I am familiar with only one reason for that parable. Einstein created it as an illustration of relativistic effects. There should not be multiple explanations for it, because it only exists to serve one meaning; it is meant to illustrate Einstein's relativity.
No, there are plenty of physics examples that have multiple explanations, e.g. conservation of momentum vs. conservation of energy.
IOW, we must assume what you are attempting to demonstrate, which is a logical fallacy. Velocity does not cause time dilation; acceleration does.
No. The equation for gamma contains only v as a variable. The amount of dilation depends on v and the accumulated time difference depends on how long you are at that speed. Not the acceleration.
This is the reason that velocity does not cause time dilation, but acceleration does. Both the Earth and the ship see each other approaching with the same velocity, but if the ship changes velocity, the effects are felt on the ship, not on Earth. No one on Earth is thrown to the side when the ship changes velocity, but they are on the ship if the ship changes velocity.
That's because acceleration is not relative, so anyone accelerating knows they are changing reference frames.
Time dilation observed while under constant velocity is an illusion; only the time change seen during acceleration is real.No. There is a problem that you can't compare clocks side-by-side unless there is an acceleration, but "illusion" is not a proper decription.
0 -
You don't seem to mind opinion when it is used to attack Creationists.
This line of discussion isn't appropriate for the physics section.
I regret to say that in the 17 years or so since I observed these things, I have forgotten many of the people involved. However, it is really easy to find some examples by doing a quick Google search, were one inclined to find such examples.Does the speed of light change in time?
NYT: Cosmic Laws Like Speed of Light Might Be Changing, a Study Finds
Space.com: Speed of Light, Other Constants May Change
I could easily pull up several more examples. It is interesting to me that the last 2 news stories are from 2001, a decade after I heard the matter was settled and buried. That shows how much I've kept up with it.
Not too surprising to me. Scientists are always attempting to confirm results using other methods, or (better yet) find new physics in better investigations.
0 -
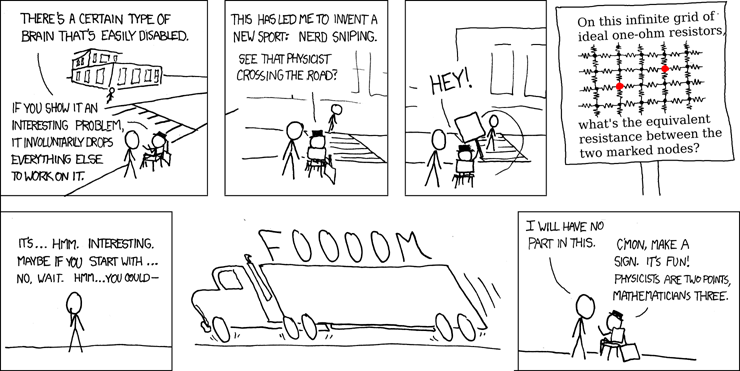
So what's the answer?
A little less than an ohm. You can solve it using Green's functions. Yecch.
0 -
0
-
To Swansont
I do not have an internet citation for the CO2/temperature relationship. I first read it in Patrick Michaels book "Meltdown", which shows how an exponential increase in CO2 leads to a linear increase in temperature (Figure 2.4 on page 16). I have seen in on an internet source, but I did not keep the reference. Perhaps another person can post such a reference?
This relationship is accepted climate science and is not controversial. Of course, it depends on how much the CO2 increase is. If there is a very strong curve on the CO2 graph, the temperature increase will also be a curve. However, the past 30 years in the real world saw an exponential growth in CO2 and an approximate linear growth in temperature, as fits this relationship.
I would really prefer not to keep arguing the point of using the last 30 years as a reference. A glance at a temperature graph for the last century will give you the answer. Before 1976 the warming or cooling has too many variables. Only after 1976 do we have a simple situation with CO2 increase causing warming, without the complication of other very powerful factors.
For example: 1941 to 1976 saw a net cooling. This makes that time period inappropriate as a reference in discussing global warming. The big difference between 1941 to 1976, and 1976 to 2007, is that the earlier time period was very strongly affected by several other factors - mainly sunspot activity change, and possible aerosol pollution change - while 1976 to present shows a simpler picture, with such extraneous factors being only of relatively minor concern. Do you not understand this?
I understand your claim. What I'm pointing out is that you have not presented any evidence to support it. How do you know that there are no other contributions to warming? Without support, the choice of date is arbitrary.
Take your choice of 1941 to 1976. 1941 and the vicinity represents a local peak, from the temperature graph you have previously cited. But 1976 does not represent the end of the cooling; the temperature reaches a minimum around 1950. Solar variation ends by 1960 and is small for several years before that. "1941 to 1976 saw a net cooling" is a true but an inaccurate statement since "1941 to 1950 saw net cooling" better represents the data.
Your claim that other forcings were or were not present in the respective periods demand supporting quantitative evidence.
0 -
The control run of 15 GCMs is interesting in two ways, firstly the wide variety of assumed average temperatures and secondly the "flatness" of the runs. (They do not include CO2 or Solar Variance.) Does this mean that a basic assumption of the models is that without Solar Variation the climate will not change? (Which is not too unreasonable.)
From a physics standpoint, with no variation in the driving terms, and only feedback, and under the assumption that you start in equilibrium, that sounds like a reasonable assumption.
0 -
Swansont
Please read the following, since you do not appear to have read my earlier postings.
I have said before so many times. I am not claiming a linear extrapolation. Just that, the past 30 years have approximated linear, which makes it less likely that a major departure will occur in the near future.
Ironic that you would say this because I said nothing about a linear projection in that post.
But your statement is self-contradictory. It says basically, that the trend is linear and will continue to be so, which is a linear extrapolation.
And yes. Long term trends can be and have been tested scientifically. It is simple. You make a prediction from a long term trend and see if it happens. Often, it does. At least a lot more often than predictions from other methods. Historically, projecting long term trends is a more reliable method of making predictions than almost any other. Of course, any prediction is very likely to fail, including those from long term trends, and from computer models.
But you have to justify that 30 years is a long-term, among other things.
And no. 30 years is NOT arbitrary, as I have explained to you many times. It is the ONLY part of recent history in which global temperature change has occurred clearly as a result of greenhouse gas increase without some other factor dominating.
But how do you justify this, other than saying it's the region that looks more-or-less linear? That's a circular argument. The previous 25 years look linear, too, but with a smaller slope. Why isn't that a case of "clearly CO2 had a smaller effect then?"
For 30 years we had steady warming to a total of 0.5 C in line with the steady CO2 growth. For the 35 years before that we had a net cooling of 0.2 C, which makes it hard to talk about global warming for THAT period. For the 30 years before that, we had warming of 0.4C, but with only trivial CO2 growth, making a cause and effect conclusion rather shaky. And for the 30 years before THAT, we had cooling, associated with almost exactly the same trivial CO2 growth associated with the 0.4 C warming.
ONLY the last 30 years shows a clear cut relationship between CO2 and warming. Do you get it now? Choosing 30 years is far from arbitrary. It is the ONLY time period with a clear relationship between CO2 and warming.
But CO2 was not steady (linear), it was faster, something like an exponential. You've previously claimed that there is a certain relationship between CO2 and temperature to attempt to justify this, but did not provide a citation for it.
Again, it's a circular argument. At some point you have to tie it back to some physics to justify your assertions, and you haven't done this.
0 -
I agree that warming will most probably continue for some time to come, and will be significant. I come to that from a slightly different angle, in that the warming in response to greenhouse gas increase over the past 30 years has been steady. This means a long term trend, and long term trends have been shown by history to have a tendency to continue.
And this is where you will find disagreement, because does not have a solid basis in science or math, and we've been through all of this. "long term trends have been shown by history to have a tendency to continue" is self-fulfilling; if you have a long-term linear process then you have a long-term linear process. But you haven't established that this trend is actually linear. 30 years is arbitrary; there is an obvious reduction in slope prior to that. The justification that you can only use that range because it's clearly dominated by CO2 is a circular argument in the absence of supporting information. The use of a linear fit is artificial, since nonlinear functions will exhibit linear behavior if limited data is used. The CO2 driving term is increasing exponentially.
0 -
From what I've read, it's a far more significant problem in regional climate models, because the large "grid" size can ignore local effects that are below that resolution.
0 -
Now that we have gotten the invective out of the way, how about we can it, and stick to the science.
0 -
Oh, good grief. Spend the day away froom the board (with the relatives) and look what happens.
Time to close the thread.
0 -
Farsight, after reading through this thread it sounds like you are a believer in String Theory.
I think Farsight is on record as not being a proponent of string theory.
0 -
Peer-review of a paper that uses a model tests the model. Either the results are good or they're not. And Hansen works at GISS, so that's probably not a good example of a researcher using a model developed elsewhere.
And YMMV. I've developed models of atomic behavior in papers I've written. Nothing on the scale of GCMs, but any application of equations to predict or explain behavior is a model. And I've borrowed models from other papers, because the paper demonstrated that they work.
0 -
When we regulate, it always seems to involve some sort of licensing, and ridiculous set of standards that every business has to meet - this always involves large amounts of money (the cost of which is passed to the consumer) and creates monopolistic bubbles that dissuade competition. Depending on the particular market of course, it can be too difficult to initialize your business - so competition becomes scarce (which also costs the consumer) and in some cases, like energy, becomes nil - which is a self fulfilling prophecy of even MORE regulation since now they really are a monopoly - a government enabled one. ( And yes, even MORE cost to the consumer).
But cost being passed along to the consumer implies that the older way of doing business — that was endangering the consumer — was cheaper. Businesses generally won't voluntarily go with a more expensive process unless they can somehow recover the expense, because they can't otherwise compete as effectively (they would have to leverage e.g. higher quality to justify the higher price)
0 -
Note that something can be the "largest uncertainty" and still be smaller than the contibution with which it's associated. The description tells you nothing of its actual magnitude.
From Swansont" But that also means you can't exclude a result, either."
Correct. However, what we are talking about are probabilities only. I consider it improbable that long term trends that are very consistent will suddenly change. Unless, of course, a new factor enters the situation. For the past 30 years, we have had a steady increase in CO2 and a similarly steady increase in temperature. If this continues, then we can expect the temperature increase to remain steady.
But that's still assuming that the system is linear. To exclude results, you have to have a physical basis for doing so. Which means quantifying effects, and that means modeling it. Without that, any prediction is baseless.
I saw the opposite in Al. Gore's atrocious movie. He showed the current warming as a straight line, and then added another straight line at a much steeper angle as the prediction. Al. baby; it don't work that way!
But it does work if the slope had stayed the same? AFAIK the graph was predicting what would happen of CO2 kept increasing at its exponential rate. Without reference to the actual curve, and the model & data it's based on, you really can't say one way or the other.
Of course, a new factor could easily enter. It has happened before. It happened in 1910 when sunspot activity suddenly increased, and a 30 year cooling turned into a 30 year warming. It happened again in 1940 when sunspot activity suddenly fell and the world cooled by 0.2C. Something similar could easily happen again, but the outcome would be as likely a cooling as a warming.But the context here is a doubling of CO2; what is the effect of that? The prediction is conditional. Other factors will have different effects, but they, too, can (and must) be quantified. But it's perfectly valid to estimate the effect of a single forcing, that being a doubling of CO2.
0 -
If you mean from a faucet like this:
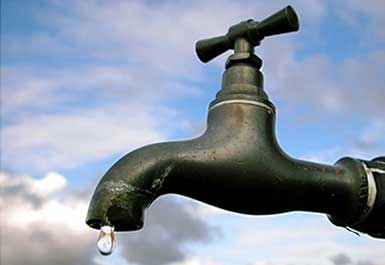
Then I think the distance would remain the same, I mean the gravitational attraction would be the same for all the drops, so there is no reason they could get closer or further":doh:
Sorry, no.
No reason? Reread the thread and perhaps you can find one.
0 -
Also it appears you are misreading my earlier posts. I try to make it very clear that predictions are uncertain. I do not think I ever said that future warming would be linear. What I have tried to say is that a major change in the near future is unlikely. This follows simply from the fact that the last 30 years have been approximately linear, and since long term trends rarely change rapidly, a change to dramatic exponential growth in the next 30 years is unlikely. Sure, it could happen, but if warming becomes exponential, after 30 years of almost linear, it will probably do so gradually.
You quoted my statement :
"If you assume that the higher part of the warming range (ie. 0.2 C per decade) is correct, then it will take 150 years for a 3 Celsius increase in average temperature on Earth. "
Did you fail to notice the first three words? I clearly noted the assumption that deduction was based on. You are fully entitled to dispute the assumption, and I will freely admit that assumption is uncertain. The warming range could indeed rise above the 0.2 C per decade.
I saw them. They quantify the slope of a straight line. And you've clarified your statement. But that also means you can't exclude a result, either. If you can't predict, you can't predict.
However, I would ask you not to ascribe to my statement a clear message that future warming must be linear. I did not say that, then, and I am not saying it now. It is all based on probability. I regard, in light of history, it unlikely that we will see a major increase in warming in the near future. You can disagree, and no doubt will.
And I do disagree. I think you can predict, with some degree of accuracy. Even if one agrees with your objections about problems with the of multiple variables, it would seem that the changes of a single forcing, CO2, could yield reasonable predictions.
"My sense is that limiting the data to the past 30 years is the only way that Lance can justify his conclusions regarding future trends."
I hope you realise that this is getting real close to the ad hom you accuse me of. Watch out for the chance that you might be getting a wee bit hypocritical.
No, that's not anywhere close to an ad hom. iNow is attacking your methodology (restricting a data set), not you.
0 -
if it had a shred of validity then it would have become acepted theory instead of being discarded by well, eery serious professional in relevant fields.
"Eery serious professionals"? Geez, I know we're a little strange, but I don't think we're that bad.

———
Eponymous self-reference and WTC stuff? Moved to speculations.
0
Homemade nuclear reactor?
in Chemistry
Posted
Tritium is a source of betas, not alphas. I don't think there are any naturally occurring alpha emitters lighter than lead.
As far as the link in the OP goes, it says it was published on April 1st, and elsewhere they admit that one of their experiments is a joke. Care to guess which one?