

arc
-
Posts
978 -
Joined
-
Last visited
Content Type
Profiles
Forums
Events
Posts posted by arc
-
-
You just said in that 'last' post:
"These events occur at very precise times of dramatic change within the 14C solar magnetic record seen on the graph." ...
There are only two graphs in that post and both are modified by me from an original graph from this site here;
http://pubs.usgs.gov/fs/fs-0095-00/fs-0095-00.pdf
The Bond reference that you have alluded to is from this site here;
http://www.ncdc.noaa.gov/paleo/ctl/clisci10kb.html
That quote;
"Certain isotopes, such as carbon-14, are formed when cosmic rays hit plants and can be measured in ancient tree rings because they cause the formation of carbon-14 that can be measured in ancient tree rings. High levels of carbon-14 suggests an inactive sun. In his research Bond noted that increases in icebergs and drift ice occurred at the same times as the increase in carbon-14, indicating the sun was weaker at such times."
does not appear in my post, the base graph in my post does not appear in this Bond article that the quote above originates.
And back when I agreed with you that it was poorly done by whoever wrote it, I said it was likely a lowly office clerk at NOAA. I do not believe they were quoting Bond directly either, it looks like someone just wanted to edit it down to a smaller size, and did not care if it was woefully inadequate in explaining the subject matter.
I believe I should be able to mention "14C" in a post without it being extraneously associated to far flung sites and poorly edited text by anonymous clerks.
But if that quote bothers you so much and keeps you up at night, why don't you write NOAA and tell them they should . . . . .

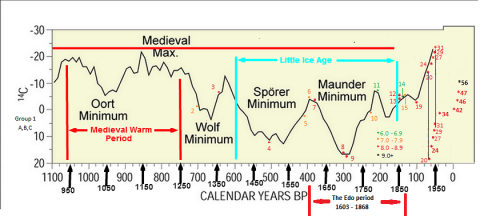
And when you get a chance maybe you could explain why the solar magnetic flux, climate temperature and earthquakes are all correlated, in not only timing, but intensity also. The strongest quake in recorded history, up until the 9.0 in 2011, occurred during a 20-30 year period when the solar magnetic flux was at its lowest recorded point called the Maunder Minimum. This was also when The Little Ice Age was in full swing.
So, the model says; as the solar magnetic flux increases the mantle will be displaced, and in turn will open the divergent boundaries, warming the ocean thermohaline and in turn the climate. And when this process is reversed and the solar magnetic flux decreases the mantle subsides, and in turn the divergent boundaries will slow and even stop, and the oceans will cool, pulling the climate down to colder temperatures. During this time the crust is of course being compressed by the previous boundary infill on one side and the convergent trench on the other.
So now you should understand why at that low point of solar magnetic flux there was a low point in climate temperatures while there was also one of the largest earthquakes . . . . . .or it could be just another one of those three way coincidences that are always happening.
#9 on the graph is;
http://en.wikipedia....Åei_earthquake
The 1707 Hōei earthquake, which occurred at 14:00 local time on October 28, 1707, was the largest earthquake in Japanese history until the 2011 Tōhoku earthquake surpassed it. It caused moderate to severe damage throughout southwestern Honshu, Shikoku and southeastern Kyūshū. The earthquake, and the resulting destructive tsunami, caused more than 5,000 casualties. This event ruptured all of the segments of the Nankai megathrust simultaneously, the only earthquake known to have done this, with an estimated magnitude of 8.6 ML. It might also have triggered the last eruption of Mount Fuji 49 days later.
0 -
I point out again the error in the author's work that you keep quoting on the C14. He says there's more C14 in the plants because of more cosmic rays hitting plants, but this is not what happens. The C14 is created in the upper atmosphere and the plants respire the C14.
Yes, quite awhile agowe discussed a poorly worded paragraph in an otherwise valuable NOAA article;
http://www.ncdc.noaa.gov/paleo/ctl/clisci10kb.html
It referenced a link that Bond suggests was between periodic seafloor iceberg deposits and 14C content proxies, but I neither quoted nor referred to it in that last post. I fail to see your reasoning at claiming I did or how it relates to the discussion at hand.
Edit: correct content error.
0 -
,Ophiolite, I believe it is sufficient. And it does make clear correlations. The earthquakes that I have listed were the complete record that is available at;
http://en.wikipedia.org/wiki/List_of_earthquakes_in_Japan
I felt it was correct to list the entire catalogue due to the fact I was explaining, in what I believe was adequate detail, the models plate movement in relation to what was seen in the record. I thought simply color coding the magnitudes would allow anyone to follow the relationship of the large scale plate movement to the solar magnetic flux. It appears by your involvement at this time that I was insufficient in explaining this.
Edit: This post was not finished but has for some reason unknown to me become posted. I will continue with a followup post. My apologies.
The single commonality in all of these earlier events listed is that they were large enough to be noted. Although their magnitudes were calculated hundreds of years later, they became part of the historic record because they killed enough people to be remembered for generations.
The four most important earthquakes in this record regarding this model are the following;
# 6; – February 3, 1605, 7.9 MK, Name: 1605 Keichō Nankaidō earthquake, location: 33.5°N 138.5°E, DT. 5,000+, It had an estimated magnitude of 7.9 on the surface wave magnitude scale and triggered a devastating tsunami that resulted in thousands of deaths in the Nankai and Tōkai regions of Japan.
# 7; – December 2, 1611, 8.1 M, Name: 1611 Keicho Sanriku earthquake, location: 39.0°N 144.4°E, DT. 2,000+ epicenter off the Sanriku coast in Iwate Prefecture.
# 8; – December 31, 1703, 8 ML, Name: 1703 Genroku earthquake, DT. 5,233 This earthquake shook Edo and killed an estimated 2,300 people. The earthquake is thought to have been an interplate earthquake. This earthquake then resulted in a tsunami reported to have caused more than 100,000 fatalities.
# 9; – October 28, 1707, 8.6 ML, Name: 1707 Hōei earthquake, Off the Kii Peninsula, DT. 5,000+ Struck both the Nankaidō and Tokai regions, causing moderate to severe damage throughout southwestern Honshu, Shikoku and southeastern Kyūshū.
The estimated magnitudes for the 1605-1611 set range from 7.9 to 8.1. The 1703 and 1707 events were 8.0 and 8.6 and look able to stand alone in their ability to kill and be remembered within that general time period. They destroyed villages and sent tsunamis down the coastline.
These events occur at very precise times of dramatic change within the 14C solar magnetic record seen on the graph. These are 8.0+ quakes involving large interplate eruptions over wide areas. This model explained in a very simple manner the relationship between the solar magnetic flux and the movement of the Pacific plate. I do not want to repost more content than needed to explain this. http://www.scienceforums.net/topic/73730-plate-tectonic-mechanism/page-14#entry803939
The model would expect that the largest quakes would occur during these dramatic changes in solar flux. I have explained many times in this thread that the crust has at any moment a given amount of gravitational potential energy. This energy is put there when the mantle slowly subsides as the core thermally contracts. The crust must increase subduction to release this building compression but can only process it to a certain limit thus requiring it to store the remainder as gravitational potential energy.
The crust must continually adjust as this potential compressive energy loads and unloads through these cycles. As the core thermally expands the mantle is displaced, opening the divergent plate boundaries in a process that actually removes some of that fossil gravitational potential energy stored away over the endless cycles. The convergent boundary trenches along the Pacific plate are subjected to the loading and unloading of this energy more than any other divergent boundary, and this energy is seen at its highest potential in the form of earthquakes at points where the solar magnetic flux sharply changes direction of its content.
You can see this entire process in the graph.

The reduction in solar magnetic content from the #7 - 1611 Sanriku earthquake to the lower level of the #8 1703 Genroku and #9 1707 Hōei earthquakes would initiate the process of loading gravitational potential energy into the crust. Compression would have been slowly building as the solar magnetic content reduced over the following years. That Maunder Minimum is one of, if not the lowest point found in our rather short 11,000 year solar magnetic record.
The longer the stay is at the lowest point the more compression will be loaded into the plate and the adjacent trench. The flat area of the Maunder Minimum was a point of tremendous compression building in the subduction zone.
The #7 earthquake reduced some of the compression in the plate from the initial drop in solar magnetic content, but that flat line at the bottom allowed more to build. What was the final result of this?
http://en.wikipedia.org/wiki/1707_H%C5%8Dei_earthquake
The 1707 Hōei earthquake, which occurred at 14:00 local time on October 28, 1707, was the largest earthquake in Japanese history until the 2011 Tōhoku earthquake surpassed it. It caused moderate to severe damage throughout southwestern Honshu, Shikoku and southeastern Kyūshū. The earthquake, and the resulting destructive tsunami, caused more than 5,000 casualties. This event ruptured all of the segments of the Nankai megathrust simultaneously, the only earthquake known to have done this, with an estimated magnitude of 8.6 ML. It might also have triggered the last eruption of Mount Fuji 49 days later.
The solar magnetic flux eventually began climbing again, and with it the divergent boundaries received an increasing infill. But the extension of the Pacific plate that opened the divergent boundaries also reduces compression at the Japanese convergent boundaries due to the shear stresses the plate was subjected to from the outward displacing mantle. The faster the rise in solar magnetic flux the greater the shear force, as it is the plates size that determines those changing stresses at the convergent trenches. # 10 would fit this nicely.
http://en.wikipedia.org/wiki/1771_Great_Yaeyama_Tsunami
The 1771 Great Yaeyama Tsunami (also called 明和の大津波, the Great Tsunami of Meiwa) was caused by theYaeyama Great Earthquake at about 8 A.M. on April 24, 1771, south-southeast of Ishigaki Island, part of the formerRyūkyū Kingdom and now forming part of present day Okinawa, Japan. According to records, 8,439 persons were killed on Ishigaki Island and 2,548 on Miyako Island.
As the Pacific plate was stretched the convergent boundary found some room to slip from the grip of its former compressed angle and released a tsunami as well as the seismic energy.
Well on to the next, # 11 as the solar magnetic content falls into a swarm of earthquakes. These are all at a point of great change in the solar magnetic flux. #12 and #13.
#12-The 1854 Tōkai earthquake was the first of the Ansei Great Earthquakes (1854–1855). It occurred at about 09:00 local time on 23 December 1854. It had a magnitude of 8.4 and caused a damaging tsunami. More than 10,000 buildings were completely destroyed and there were at least 2,000 casualties.
http://en.wikipedia.org/wiki/1854_Ansei-Nankai_earthquake
#13- The 1854 Nankai earthquake occurred at about 16:00 local time on 24 December 1854. It had a magnitude of 8.4 and caused a damaging tsunami. More than 30,000 buildings were completely destroyed and there were at least 3,000 casualties.[1]
It was the second of the three Ansei Great Earthquakes; the 1854 Ansei-Tōkai earthquake of similar size had hit the area the previous morning.

From this point on the solar magnetic energy level climbs faster and higher than it has in most of the last 11,000 years. This period coincides with the climate warming that has followed the increasing solar magnetic energy since the end of The Little Ice Age at around 1850.
This should provide tremendous divergent boundary infill metrics and large shear stresses at the Pacific plate convergent boundaries.
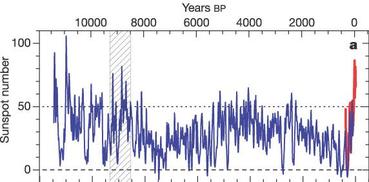
http://www.ncdc.noaa.gov/paleo/pubs/solanki2004/solanki2004.html
Fig.4
Unusual activity of the Sun during recent decades compared to the previous 11,000 years
Nature, Vol. 431, No. 7012, pp. 1084 – 1087, 28 October 2004.
S.K. Solanki1, I. G. Usoskin2, B. Kromer3, M. Schüssler1, and J. Beer4
1 Max-Planck-Institut für Sonnensystemforschung (formerly the Max-Planck- Institut für Aeronomie), 37191 Katlenburg-Lindau, Germany
2 Sodankylä Geophysical Observatory (Oulu unit), University of Oulu, 90014 Oulu, Finland
3 Heidelberger Akademie der Wissenschaften, Institut für Umweltphysik, Neuenheimer Feld 229, 69120 Heidelberg, Germany
4 Department of Surface Waters, EAWAG, 8600 Dübendorf, Switzerland
“According to our reconstruction, the level of solar activity during the past 70 years is exceptional, and the previous period of equally high activity occurred more than 8,000 years ago. We find that during the past 11,400 years the Sun spent only of the order of 10% of the time at a similarly high level of magnetic activity and almost all of the earlier high-activity periods were shorter than the present episode.”
#56; – March 11, 2011,05:46:23 UTC, (14:46 JST), 9.0 Mw, Name: 2011 Tōhoku earthquake, location: Tōhokuchihō Taiheiyō Oki Jishin, (Higashi Nihon Dai-Shinsai), 38.510°N, 142.792°E, depth 24.4 km, 15,883 deaths, confirmed.
#57; – March 11, 2011, 06:25:50 UTC, 7.1 Mw, Name: 2011 Tōhoku earthquake aftershock, location: Tōhokuchihō Taiheiyō Oki Jishin (Higashi Nihon Dai-Shinsai), 38.106°N, 144.553°E, depth 19.7 km.
#58; – April 7, 2011, 23:30:00 JST, 7.1 Mw, Name: 2011 Miyagi earthquake aftershock, location: 38.253°N, 141.640°E, depth 49 km, DT. 4
#59; – April 11, 2011, 17:16:13 JST, 7.1 Mw, Name: 2011 Fukushima earthquake aftershock, location: Fukushima-ken Hamadori Jishin 37.007°N, 140.477°E, depth 10 km, DT. 6
#60; – July 10, 2011, 10:57:12 JST, 7.0 Mw, Name: 2011 Fukushima earthquake aftershock, location: 38.040°N, 143.287°E, depth 49 km, DT. 0. Quake was centered c. 242 km SW of Hachijo-jima.
#61; – January 1, 2012, 14:27:54 JST, 6.8 Mw, Name: Izu Islands, Japan, location: 31.416°N, 138.155°E, depth 348.5 km. 242 km (150 miles) SW of Hachijo-jima, Izu Islands, Japan.
#62; – December 7, 2012, 17:18:24 JST, 7.3 Mw, Name: 2012 Kamaishi earthquake, location: 37.700°N, 144.600°E, depth 32.0 km, 293 km (182 miles) SE of Kamaishi, Japan, 492 km (306 miles) ENE of Tokyo, Japan.
Can the solar magnetic flux climb any higher? The next 20 years will prove or disprove this hypothesis.Edit: Needed to fix errors in content.0 -
arc, please clarify: are you maintaining that your data set of earthquakes is sufficiently accurate to derive from it the sort of conclusions you are deriving? (Here is a helpful hint: it isn't.) Now, if you wish this thread to remain in the serious part of the forum I recommend you apply some self critical assessments of your own work and withdraw some of your weaker (i.e. unfounded) claims.
,Ophiolite, I believe it is sufficient. And it does make clear correlations. The earthquakes that I have listed were the complete record that is available at;
http://en.wikipedia.org/wiki/List_of_earthquakes_in_Japan
I felt it was correct to list the entire catalogue due to the fact I was explaining, in what I believe was adequate detail, the models plate movement in relation to what was seen in the record. I thought simply color coding the magnitudes would allow anyone to follow the relationship of the large scale plate movement to the solar magnetic flux. It appears by your involvement at this time that I was insufficient in explaining this.
Edit: This post was not finished but has for some reason unknown to me become posted. I will continue with a followup post. My apologies.
0 -
3) Where are the mods?
IIRC there have been only two mod posts, #2 a question by CaptainPanic and #247 a warning you may recall by swansont; http://www.scienceforums.net/topic/73730-plate-tectonic-mechanism/page-13#entry786562
Can we have some impartial intervention to sort this mess out please?
Aw c'mon, fight your own fight.
 OK, lets take off everything below an 8.0 that didn't have fatalities, starting at the point when seismographs were commonly considered first tested in Japan. I believe that would be #16; – July 28, 1889, 6.3 M, Name: 1889 Kumamoto earthquake, location: Tatsuda fault, First major earthquake after the establishment of the Seismological Society of Japan in 1880. So that one would be removed from the list, I'll work on the rest tomorrow after I get home from work. 0
 -
That doesn't mean there isn't convection. It just means that convection does not equal plate motion
And the name of this thread is called Plate Tectonic Mechanism? rather than; "Things that are not Plate Tectonic Mechanism?"
But, such as you finally admit that convection does not produce plate movement. I am happy to see you are finally coming around.
It was not that long ago . . . . . .
http://www.scienceforums.net/topic/73730-plate-tectonic-mechanism/page-13#entry786479
Posted 11 January 2014 - 05:29 PM
"So you would agree that plate tectonics is fundamentally driven by mantle convection?"
"It is the requirement due to the laws of thermodynamics that the Earth tends towards a state of thermodynamic equilibrium with space (i.e. it cools down) that drives plate motion. That is a loose mechanism. The dynamics have not been worked out. But the simplicity of the idea is elegant isn't it?"
Ah, those were the days of youthful exuberance, anything seemed possible. Santa Claus, Easter Bunny, convection driven plate movement. Oh, to be young again!
there is some amount of decoupling between the rigid lithosphere and the underlying mantle. Convection in the Earth is a consequence of physics, and there is plenty of maths there for you to read in the literature should you search for it.
And there is currently no verifiable evidence of convection within the Earth, just conjecture. But I have no problem with you practicing your religion in the privacy of your own mind.
Let me ask you a question. Without convection how does anisotropy develop in the mantle?
Oh, I don't know. Maybe its from the mantle being displaced tens of million of times by a thermal expansion cycle of the outer core.
Grrrrr. How can you honestly believe that there were only 22 earthquakes in over 1200 years, followed by over 40 in the last hundred years? You actually believe there has been double the seismic activity in the last 100 years than in the previous 1200 years combined????? Are you that naive? You are taking the bias in your dataset as your trend!! Come on, please, this is a basic error! It makes me so frustrated to have to have this argument. If you were serious about science you would simply seek out a better dataset -- I could help you -- but alas you are not serious about science, only the propagation of your beloved mechanism.
OK, you seem stuck on this. Lets look at that graph you hate so much.

I overlayed the Edo period, it started in 1603 and ended in 1868. What was the Edo period like?
http://en.wikipedia.org/wiki/History_of_Japan
"The Edo, or Tokugawa period saw power centralized in the hands of a hereditary shogunate that took control of religion, regulated the entire economy, subordinated the nobility, and set up uniform systems of taxation, government spending and bureaucracies. It avoided international involvement and wars, established a national judiciary and suppressed protest and criticism. The Tokugawa era brought peace, and that brought prosperity to a nation of 31 million."
"In the cities and towns, guilds of merchants and artisans met the growing demand for goods and services. The merchants, while low in status, prospered, especially those with official patronage. Merchants invented credit instruments to transfer money, currency came into common use, and the strengthening credit market encouraged entrepreneurship."
"By 1800 the commercialization of the economy grew rapidly, bringing more and more remote villages into the national economy. Rich farmers appeared who switched from rice to high-profit commercial crops and engaged in local money-lending, trade, and small-scale manufacturing. Some wealthy merchants sought higher social status by using money to marry into the samurai class."
BIlliards, This was a developed economy, with a bureaucratic government that kept records for properties, taxes, debts, census' and every other public transaction a controlling government would administer. Banks, schools, industries and military.
http://en.wikipedia.org/wiki/Japan#Geography
About 73 percent of Japan is forested, mountainous, and unsuitable for agricultural, industrial, or residential use. As a result, the habitable zones, mainly located in coastal areas, have extremely high population densities.
There were 31 million people in that 27% that is the habitable area. Japan is a little smaller than Montana. That would be 31 million people in just over a 1/4 of Montana. Most all in a tsunami zone.
Take a look at that graph again. Now you tell me they wouldn't have had every Earthquake larger than 7.0 recorded. How about just from 1800 to when the first large swarm is recorded at 1854. Do you really think they missed any from 1800 to 1854!
Yes!, they had thousand of earthquakes smaller than 7.0 before, during and after the Edo period, but again, the were smaller than 7.0. Get it! And starting about 1854 quakes greater than 7.0 grew in number as the solar magnetic flux increased! Get it!
As I said also in post #322;
"So, I am only interested in the convergent boundary earthquake metrics of the largest plate because it would amplify the mantle displacement greater than any other plate of lesser proportions. The plate size is analogous to the beam that holds the needle on a seismograph, the longer the beam (plate) the more movement will be recorded. So a smaller mantle displacement metric would be amplified into more movement and likely as a quake in Japan but not in, say, the mediterranean."
This record is accurate for a HISTORICAL record of earthquakes over 7.0. The Edo period is consistent with the earlier portion of the
record. There appears to be consistency prior to and through the Edo period and they track solar magnetic flux accurately with most quakes occurring at or near large changes in solar magnetic content.
"How can you honestly believe that there were only 22 earthquakes in over 1200 years, followed by over 40 in the last hundred years? You actually believe there has been double the seismic activity in the last 100 years than in the previous 1200 years combined"
WOW! I never said "that there were only 22 earthquakes in over 1200 years", That is some crazy tangent that you have grabbed and ran screaming down the aisles with.
Did you not look at the record at;
http://en.wikipedia.org/wiki/List_of_earthquakes_in_Japan
Here is the Edo period quakes over 7.0, only 10 in total yet thousand of others below 7.0 occurred, Get It! Please note the Death Tolls; DT;
6; – February 3, 1605, 7.9 MK, Name: 1605 Keichō Nankaidō earthquake, location: 33.5°N 138.5°E, DT. 5,000+, It had an estimated magnitude of 7.9 on the surface wave magnitude scale and triggered a devastating tsunami that resulted in thousands of deaths in the Nankai and Tōkai regions of Japan.
7; – December 2, 1611, 8.1 M, Name: 1611 Keicho Sanriku earthquake, location: 39.0°N 144.4°E, DT. 2,000+ epicenter off the Sanriku coast in Iwate Prefecture.
8; – December 31, 1703, 8 ML, Name: 1703 Genroku earthquake, DT. 5,233 This earthquake shook Edo and killed an estimated 2,300 people. The earthquake is thought to have been an interplate earthquake. This earthquake then resulted in a tsunami reported to have caused more than 100,000 fatalities.
9; – October 28, 1707, 8.6 ML, Name: 1707 Hōei earthquake, Off the Kii Peninsula, DT. 5,000+ Struck both the Nankaidō and Tokai regions, causing moderate to severe damage throughout southwestern Honshu, Shikoku and southeastern Kyūshū.
10; – April 24, 1771, 7.4 MK, Name: 1771 Great Yaeyama Tsunami, location: 24.0°N 124.3°E, DT 13,486
11; – May 21, 1792, 6.4 MK, Name: 1792 Unzen earthquake and tsunami, location: 32.8°N 130.3°E, DT 15,448, changing of the Ariake Sea coastline, in the center of Mount Unzen, Kumamoto Prefecture and the Amakusa Islands were affected by the tsunami.
12; – December 23, 1854, 8.4 MK, Name: 1854 Ansei-Tōkai earthquake, location: Suruga Bay, DT. 2,000
13; – December 24, 1854, 8.4 MK, Name: Ansei-Nankai earthquake, location: Nankai Trough, DT. 10,000+.
14; – November 11, 1855, 6.9 MK, Name: Ansei Edo earthquake, DT. 6,641, One hundred and twenty earthquakes and tremors in total were felt in Edo (capital) in 1854–55. And almost all but a few were under 7.0, GET IT!
15; – April 9, 1858, 7.0-7.1 Name: Hietsu earthquake, location: Atotsugawa Fault, DT.200–300
Why do I get the feeling it is pointless to explain this to you.
0 -
I get what you're saying but I really don't want to write anything based on this experience. For one thing it's been incredibly painful for me and if I ever do get past this I want to put it behind me and never think of it again. Secondly I am afraid that what this theory has done to me will do the same thing to other creative types and I don't want to put them through that.
And again what I need is a straight, black and white answer, I want to see anything else on this thread except an answer to this question:
Are these two theories true? Yes or no?
I'm guessing you are simply afraid of failure and needed to create in your mind a reason to lock in a bulletproof excuse to yourself, one that can convince you to not even try. Good luck with that, it seems to be working. Strange use for ones creativity don't you think.
0 -
I haven't run out of tactics, I've run out of patience.
Apparently not.
The problem is that this would not serve the debate. Your model is under scrutiny here, not the standard one.
Oh, but the standard model is under scrutiny.
Science is about gathering information and comparing it. The value of a product compared to itself is indeterminate. Would you take the word of any salesperson that said; "No! Don't look at any others anywhere else, they are all junk, believe me mine's the best."
I can't believe you would suggest such a thing. The value of anything is determined by comparison to its direct competitor. We want the best that we can determine, not the only one nobody wanted. When you were a kid and they were picking teams, did they choose the worst player first!
You don't want to have your model compared to mine while I want my model compared to yours. Hmm. If we were selling something (and we both are) do you think everyone would trust someone trying to discourage access to other choices? Which product would they suspect was the better product?
The standard model of plate tectonics links together the palaeo magnetic lineation data, the palaentology data, the volcanology data, the seismic tomography data, the seismic anisotropy data, the seismic earthquake mechanism data, and other geological data. The kinematic theory of plate tectonics predicts where the plates will end up in millions of years. It can also be used to work out basement evolution and predict where oil will be, for example. Geodynamicists have used physics (and guess what they're past the Boussinesq approximation these days) to predict planetary evolution, and they have repeatedly developed models that show plate-tectonic behaviour, with convecting mantles.
Wow, that sounds impressive! But I suspect you are trying to hide your convection in the bottom of the barrel to sneak it in there with those other predictive observations. Oh there it is down in the bottom like I thought. Aren't you over selling that mantle convection "predict" part. Oh wait, it doesn't say predict, it says;
"and they have repeatedly developed models that show plate-tectonic behaviour, with convecting mantles"
Shame on you for trying to include that mantle convection in with those predictive observations.
. Why do I think that way? -
http://www.dst.uniro...antle_Dynamics_
"none of the proposed models of mantle convection can account for the simpler pattern in plate motion we observe at the surface, nor has a unique solution been proposed for how material in the mantle convects. At the moment there is no way to link mantle dynamics and plate kinematics at the surface, considering that the mantle and lithosphere are detached. Plates appear to follow a main stream, both now and in the geologic past, whereas mantle convection is expected to generate cells with a typical rather circular-polygonalshape."
Something else doesn't fit here.
What's so difficult to understand? Why don't you use a proper earthquake catalogue? You still haven't answered that question. You're attempts to ridicule me are not working. Your "catalogue" is incomplete and biased towards recent events. Accept it, change it, move on. Stop being a stubborn donkey.
"Your "catalogue" is incomplete and biased towards recent events"
You're back to your obfuscation again. Shame on you.
OK, I already explained this somewhat, but since you think this somehow goes somewhere because you were desperately trying to salvage your credibility immediately after your now famous post #319 fiasco;
Your earliest earthquake record is 1900. My earliest is 684 AD. Followed by 745 AD and 869 AD. My "catalogue" has 22 earthquakes before 1900 out of a total of 65.
"Your "catalogue" is incomplete and biased towards recent events"
Strange, it looks like like yours is the one biased toward recent events.

I needed the older data so I could show the correlation between 14C data, the earthquakes and both their relationships to the Medieval Warm Period and Little Ice Age. The correlation in time and intensity is spot on! But I think you noticed that.

This Japanese set is really important because it shows a clear long range historical record from one single "larger than all other" oceanic plates. Umm, your set doesn't.
As I already touched on in post #322;
"There are really no other sources of earthquake data that extend so far back in history, and its the Pacific Plate's size that produces the quantity of larger earthquakes that would undoubtedly be noted by a long lasting literate society."
So, I guess you need the longer explanation.
 As I said also in post #322;
"So, I am only interested in the convergent boundary earthquake metrics of the largest plate because it would amplify the mantle displacement greater than any other plate of lesser proportions. The plate size is analogous to the beam that holds the needle on a seismograph, the longer the beam (plate) the more movement will be recorded. So a smaller mantle displacement metric would be amplified into more movement and likely as a quake in Japan but not in, say, the mediterranean."
So, I assume you read that. What difference, other than adding to the "bias towards recent events", would including your data contribute? Where do you think you can go with this?
Though not particularly important in this application, the Japanese set is uniform due to the "beam" plate width being the same for every quake. "So, I am only interested in the convergent boundary earthquake metrics of the largest plate because it would amplify the mantle displacement greater than any other plate of lesser proportions.
If I was to include data from everywhere else this uniformity would be lost.
What's so difficult to understand? Why don't you use a proper earthquake catalogue? You still haven't answered that question. You're attempts to ridicule me are not working. Your "catalogue" is incomplete and biased towards recent events. Accept it, change it, move on. Stop being a stubborn donkey.
So now you have your answer, its not what you wanted I'm sure of that. Much ado about nothing, except to you. Oh and "move on". And, "Stop being a stubborn donkey" to you too.
So, this is what should happen now. We should both present a solution for a specific geologic phenomena. How about the Himalayan Mountain range. You tell how your model produces this range in the time sequence believed, and I will do the same. Won't that be fun! i can't wait to see your model do that!
Let's set the groundwork to frame the contest.
Dr. Ollier is a good choice to challenge one's model, he appears to be a critic of both plate tectonics and mantle plumes. But the metrics appear correct compared to other sources.
http://en.wikipedia.org/wiki/Cliff_Ollier
Cliff Ollier (born 1931) is a geologist, geomorphologist, soil scientist, emeritus professor and honorary research fellow, at the School of Earth and Geographical SciencesUniversity of Western Australia. He was formerly at Australian National University, University of New England, Australia, Canberra University, University of Papua New Guinea, and University of Melbourne.
Throughout his career he was a prolific author (as C.D Ollier), and he has contributed to reference works such as The Oxford Companion to the Earth.
ANNALS OF GEOPHYSICS, SUPPLEMENT TO VOL. 49, N. 1, 2006
Mountain uplift and the Neotectonic Period
CLIFF D. OLLIER
School of Earth and Geographical Sciences, University of Western Australia, Perth, Australia
9.2. EXAMPLES
9.2.1. Tibet, Himalayas, Kunlun Mountains
(As an example, consider the timing of uplift in Tibet and its bordering mountains. Gansser (1991) wrote: «... we must realize that the morphogenic phase is not only restricted to the Himalayas but involves the whole Tibetan block. This surprising fact shows that an area of 2500000 km2 has been uplifted 3000-4000 m during Pleistocene time and that this uplift is still going on.» In places the uplift rate is 4.5 mm/yr (five times the maximum in the European Alps). According to Wu et al. (2001) from the Pliocene to the Early Quaternary (5-1.1 Million years) the Kunlun Pass area of the Tibetan Plateau was no more than 1500 m high and was warm and humid. They write: «The extreme geomorphic changes in the Kunlun Pass area reflect an abrupt uplift of the Tibet Plateau during the Early and Middle Pleistocene. The Kunlun-Yellow River tectonic movement occurred 1.1-0.6 Million years.» Zheng et al. (2000) concluded from sediments at the foot of the Kunlun Mountains that uplift began around 4.5 Million years.)
9.4. CONCLUSIONS
(Mountains are created by the vertical uplift of former plains, independent of any folding of the rocks underneath. The age of mountains should therefore refer to the age of vertical uplift after planation, not to the last period of folding (if the underlying bedrock happens to be folded). Most uplift occurred in the Plio-Pleistocene, or the very Late Miocene. The Neotectonic Period is demonstrated by the large amount of work listed in table 9.I. Plate tectonics, the ruling theory of the past forty years, has no adequate explanation for the widespread planation in mountain regions, or the remarkably young uplift. Indeed it is based on an association of folding and uplift that is demonstrably untrue. Plate tectonics has no plausible explanation for mountains on passive margins or continental interiors. From now on it is incumbent on those who propose models of mountain formation to do two things: Incorporate planation surfaces into the story (or prove there was no former planation). – Either disprove the Neotectonic Period hypothesis, or show how their proposed mechanisms fit into the time scale of just a few million years). . . . .(Uplift occurred over a relatively short and distinct time. Some unknown process created mountains after a period with little or no significant uplift. This is a deviation from uniformitarianism. The mountain building period is relatively short, and not on the same time scale as granite intrusion (which takes tens of millions of years), or plate tectonics which is supposedly continuous over hundreds of millions of years. The same rapid uplift occurs in areas where hypotheses such as mantle plumes are not appropriate. We do not yet know what causes this short, sharp period of uplift, but we can exclude naive mountain-building hypotheses that are on the wrong time scale.) . . .(One of the biggest obstacles to our hypothesis of widespread Plio-Pleistocene mountain building is that the period of time available for the preceding planation is too short. Only further investigation can clarify this point.)
I checked it against;
http://pubs.usgs.gov/gip/dynamic/himalaya.html
The collision of India into Asia 50 million years ago caused the Indian and Eurasian Plates to crumple up along the collision zone. After the collision, the slow continuous convergence of these two plates over millions of years pushed up the Himalayas and the Tibetan Plateau to their present heights. Most of this growth occurred during the past 10 million years. The Himalayas, towering as high as 8,854 m above sea level, form the highest continental mountains in the world. Moreover, the neighboring Tibetan Plateau, at an average elevation of about 4,600 m, is higher than all the peaks in the Alps except for Mont Blanc and Monte Rosa, and is well above the summits of most mountains in the United States. . . . The Himalayas and the Tibetan Plateau to the north have risen very rapidly. In just 50 million years, peaks such as Mt. Everest have risen to heights of more than 9 km. The impinging of the two landmasses has yet to end. The Himalayas continue to rise more than 1 cm a year -- a growth rate of 10 km in a million years! If that is so, why aren't the Himalayas even higher? Scientists believe that the Eurasian Plate may now be stretching out rather than thrusting up, and such stretching would result in some subsidence due to gravity.
Billiards, use your model come up with a solution to the problems pointed out by Dr. Ollier and I will do the same. Let's see who's model gives the best predictions of observations.
This is going to be fun! Remember westward drift . . . . Good times!
http://www.scienceforums.net/topic/73730-plate-tectonic-mechanism/page-14#entry787818
0 -
Hello everybody.
This is my very first post and I warn you now it's going to be unusual.
I have always been a very creative and imaginative person, I have ambitions of becoming an author someday maybe even producing my own animated TV shows. I have always regarded creativity as a realm of infinite possibilities, where anyone and everyone can bring something unique into this world.
But lately I been feeling very depressed because of two scientific theories.
The first one was introduced to me years ago by my father who has always been very interested in science. He told me that there is a finite limit on the number of books is possible to write. Not because human imagination is limited but because a book is made up of words which are a combination of letters and as there are a finite number of letters in existence then there is a finite number of different possible books that can be written. At least not without making words progressively longer and longer until they ceased to be usable.
Let me tell you, this news absolutely devastated me. I gave up on my ambitions, on everything I'd ever believed about creativity and sank into a deep depression.
Eventually I drifted out of it but recently I've had a relapse.
The second one is this theory I've heard about which says that there is a finite limitation on the different ways that all matter can be arranged and therefore a finite limitation on the possibilities of absolutely everything. On the events that can happen, lifeforms and people that can exist and anything that an artist can ever create.
Together these theories have left me broken and with a deep feeling of hopelessness.
What I want to know is our these theories true? Have they been proven all this proven? Is there any room for definite or at least reasonable doubt?
I know that there is nothing I can do about them, I know that if they are true they will never affect me in my lifetime, I know that if they are true it's still a vast number but those thoughts bring absolutely no comfort to me whatsoever.
I know this isn't this the sort of thing you usually talk about on this kind of website but I've tried talking about it on depression websites and to my therapist and haven't really gotten anywhere.
To me there are only two options, either they are untrue and I can finally put them behind me or they are true and my life is ruined.
Also, please don't tell me just live with it because I can't.
I honestly don't know if they are true or not, it is almost a philosophy question to me. You could make up "what-if" questions all night. I am quite alarmed by the reference frame this involves. Could you choose anything bigger? There are some people that feel as hopeless as you do because the Sun will eventually destroy the Earth. Taking every possibly surviving piece of evidence of their existence. Humans are strange that way, they are worried about being forgotten. They are going to be dead or will have been dead for billions of years and that is what is concerning them now!
To beat this, and you need to feel like you really want to beat this, you need to use your creativity. You need to understand that. You say you are creative, then show what you can do with this. This is a very unique opportunity, there is unlikely anyone else that feels your particular way about this very unusual predicament.
This is a huge opportunity for you alone. No one else see's it from your perspective.
You can be the next Tim Burton. Start writing that story now! Write! Write! Write!
0 -
I made up a game for that once. Back when Pure Genius was up voting himself every day I enjoyed going all Wack-a-mole down vote on his thread. It was great fun!
You know, I don't think I have down voted anyone since then. Could we have down vote counters next to our avatar? That would shake things up.
UPDATE: I carpet bombed someone yesterday, gave em' all three . . . I don't know what came over me . . . . . . oh yeah, now I remember
 0
0 -

I'll bet a triple with cheese she's not saying; "Could I get a small garden salad without dressing and a water."
0 -
Arc, I think I have run out of words for you. I will leave with this very nice post I found by Ophiolite on another thread "spotting pseudo science."
Arc, you fall squarely into the latter camp (my bold in the quote above).
Billiards I'm afraid you have ran out of tactics to avoid my repeated requests that you provide some prediction of observations to back up your assertions that your standard model is the better model. You have yet to fulfill that obligation. I wondered how long you could maintain this charade of yours. It's rather interesting that I have provided so much evidence to support my model while you have not for yours.
I had to badger you to address post #275, and look at the results. Your first attempt was a joke! No, I mean really a joke, I'm still laughing about it. The second was your classic habit of obfuscation through your unique skill of making the simple to understand overly complicated.
So you're only considering earthquakes "which caused significant damage or casualties". In your source it says: "The present list is not exhaustive and reliable and precise magnitude data is scarce for earthquakes that occurred prior to the development of modern measuring instruments."
Why don't you use a proper earthquake catalogue?
Why don't you do a global analysis? so as to increase your confidence in the "correlation"? i.e. to protect yourself from statistical anomalies by including more data --
Many large earthquakes occur that cause little/no damage, why not include those?
Post #275 is completely useless, it is bunk.
Here is a histogram of number of earthquakes per year from a recent catalogue...
You have to be careful with these though, this catalogue deliberately has cut-off magnitudes that "were selected prior to the start of the project (Fig. 1) and were dictated by the time constraints and availability of funds:
1900-1917: Ms≥7.5 worldwide + smaller shallow events in stable continental areas
1918-1959: Ms≥6¼
1960-2009: Ms≥5.5"
http://www.isc.ac.uk/iscgem/overview.php
That's why you see those steps. If you look at the yellow bars, the Mw>=7.5, the trend is not affected by these deliberate cutoffs. There might still be biases in the data though, as older records are more likely to be lost, and record keeping would have been less rigorous than it is today.
And that makes my simple and easy to understand model more complicated and less predictive . . . . Yeah, not what I'm after. But if it works for you

I've said it before, I use simple field study and analysis. Here's my quote from Ophiolite:
Geology is the study of the Earth: how it formed, how it has changed over time and the processes that promote those changes. If you want the minimum soundbite - geology is about change in the planet. . . . . . . .
I was trained on the basis that fieldwork was an essential ingredient of geology: get out and hit the rocks with a hammer; see the lie of the land; sense the development of the environments and structures.
So I did that and it worked out pretty well for me. How's your way working out for you?
I believe you are going to be dealing with this model for a long time to come. We haven't even discussed the large majority of what this model covers. I have corresponded with my area's former state meteorologist of 19+ years, and as he told me "the idea that recent solar activity is essentially unmatched in the past is HUGE! I want to continue poring over this."
I have a feeling it's going to be interesting for the next few years.
0 -
• why don't you use a proper earthquake catalogue?
• why only use earthquakes that cause damage?
"I'm sorry my crude manner of presenting my model is so incompatible to your erudite sensibilities. But . . . . . .how much of a difference do you think there is between a 7.0 or greater earthquake then as to now?
Do you think they were missing some of those smaller than 8.5.Maybe they couldn't tell the difference between a tsunami and a high tide! "

It's going to be a long time until you live down that one down!
Billiards, you know why. I already explained it to you, its pretty simple to understand.
Because the point is to present a hypothesis and then show evidence supporting it, you know that. Do I need to repost my last post?.
Tell you what, I SHOWED MY MODEL CAN PREDICT OBSERVABLE NATURAL PHENOMENA. NOW YOU HAVE YOURS DO THE SAME!
Your attempt to inject complexity into my model's simple and easy to understand predictions and its verification through easily understood data is the antithesis of good scientific inquiry.
Maybe thats why you don't make any predictions . . . . . . . . Just a thought!
0 -
So you're only considering earthquakes "which caused significant damage or casualties". In your source it says: "The present list is not exhaustive and reliable and precise magnitude data is scarce for earthquakes that occurred prior to the development of modern measuring instruments."
Why don't you use a proper earthquake catalogue?
Why don't you do a global analysis? so as to increase your confidence in the "correlation"? i.e. to protect yourself from statistical anomalies by including more data --
Many large earthquakes occur that cause little/no damage, why not include those?
Post #275 is completely useless, it is bunk.
OK, so lets look at what I've said:
The model explains that the largest plates, due to the mantle displacement, move proportionally more than the smaller plates because;
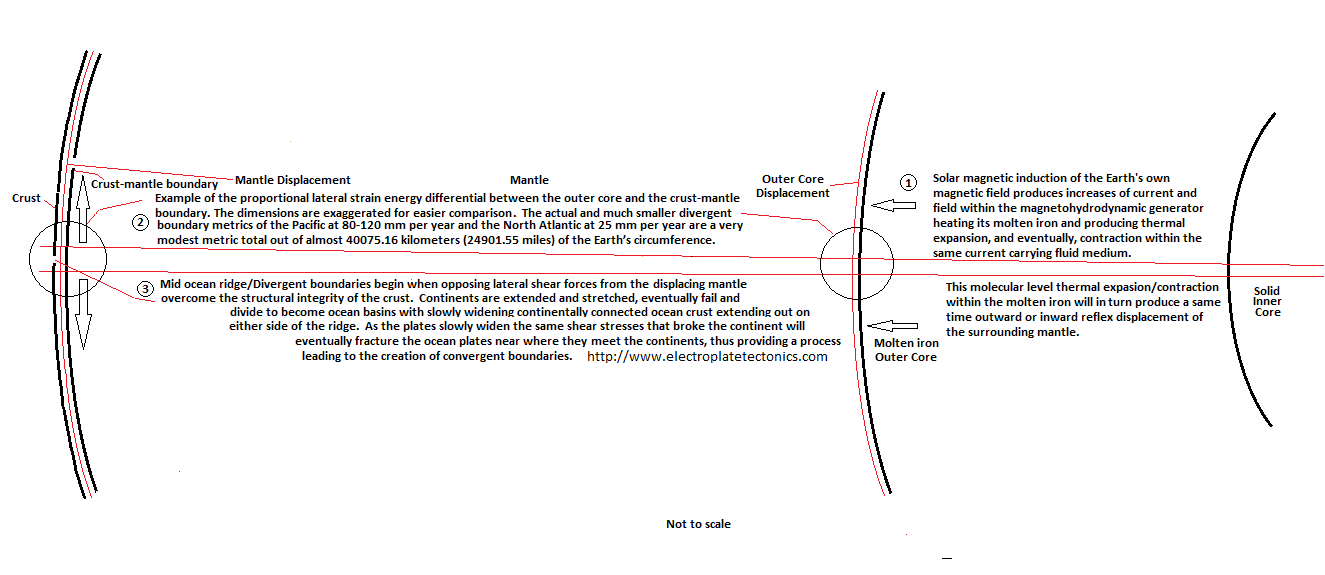
A measured thermal expansion or contraction in the molten iron of the Earth’s outer core would produce a short time frame signal, or more exact, an almost immediate response of movement in the outer mantle and crust. As the mantle displaces inward or outward from the core’s thermal expansion or contraction the crust will respond with lateral movements of divergent boundary or convergent boundary metrics. This lateral movement in the crust will vary in each plate, based on each plate’s relative size, or more accurately, its width in relation to the plate’s direction of movement.
This is simply due to the plate’s proportion to the total circumference of the Earth; the plates will move a percentage of that total gain or loss of circumference based on the plate’s relative width to that total.
As an example of this phenomena, imagine the Earth with one single belt of seafloor around the equator with one end considered attached, immovable while the other end is a short distance away unconnected. Now we apply the thermal increase that displaces the mantle and extends the crust. We can now see the gap between the plate ends open a given degree.
Now we all know that if the belt was divided in half and then in quarters it would with each reduction in length show a proportional reduction in movement. This means that a wider ocean plate like the Pacific would show more movement than a narrower one. And the Pacific plate having the widest expanse of plate material shows an unusually large amount of movement resulting in more infill. While the Atlantic being narrower shows a proportionally smaller amount of movement.
So, I am only interested in the convergent boundary earthquake metrics of the largest plate because it would amplify the mantle displacement greater than any other plate of lesser proportions. The plate size is analogous to the beam that holds the needle on a seismograph, the longer the beam (plate) the more movement will be recorded. So a smaller mantle displacement metric would be amplified into more movement and likely as a quake in Japan but not in, say, the mediterranean.
The degree of energy loading into all divergent plate boundaries will be proportionate to the plates width.
But, don't confuse this necessarily with the size of the quakes. It would seem logical that the more beam you have (plate width) the greater the severity of earthquakes. But I feel that measurement is more dependent on the conditions in the specific divergent boundary itself, plate angle and other boundary conditions.
After all, the mediterranean region has many strong quakes but lacks the long flexible ocean plate that telegraphs nicely. The mediterranean has the weight of the Alps to resist the movement of the smaller ocean plate that is connected to Africa. Europe and the Alps hold the subducted plate allowing large amounts of energy to build up, there is just not the mechanical advantage to telegraph the mantle displacement metrics that show in the Japanese records as many quakes due to more divergent plate boundary movement.
Could there be a boundary somewhere that has the large plate but little trench resistance where you could see a lot of proportionate movement without the large energy storage that culminates as bigger earthquakes? I doubt it, I think the subduction at these larger plates result in conditions of greater proportions, the Mariana Trench as an example.
There are really no other sources of earthquake data that extend so far back in history, and its the Pacific Plate's size that produces the quantity of larger earthquakes that would undoubtedly be noted by a long lasting literate society.

And you can clearly see that the earthquakes relate to the 14C energy levels rather well.
This data describes the mechanism in a specific mechanical way, a behaviour that I believe is easily understandable.
1 -
Despite my better mind wishing to "cut and run", I just can't resist to point out the major flaw in arc's oft-self-heralded "post #275."
Here arc claims to show a link between solar flux and earth seismicity (in Japan). Firstly the presentation is horrendous, so much so that it is not entirely clear that the "correlation" he finds exists whatsoever. Even if we forgive the lack of any statistical analysis, the graphical presentation is laughable. If you wish to show an increase in frequency with time, use a measure of frequency on the y-axis, please!
The argument rests on the observation that in the last 100 years solar flux is observed to increase (according to tree ring data), and the number of earthquakes detected also seems to increase. Here's the massive flaw: In the past 100 years we've got good at detecting earthquakes, and therefore we have measured more of them. The "correlation" arc has observed is simply an artifact of the bias in sampling.
Post #275 debunked.
Really!
I'm sorry my crude manner of presenting my model is so incompatible to your erudite sensibilities. But . . . . . .how much of a difference do you think there is between a 7.0 or greater earthquake then as to now?
Do you think they were missing some of those smaller than 8.5.Maybe they couldn't tell the difference between a tsunami and a high tide!
http://en.wikipedia.org/wiki/List_of_earthquakes_in_Japan
"This is a list of earthquakes in Japan with either a magnitude greater than or equal to 7.0 or which caused significant damage or casualties. As indicated below, magnitude is measured on the Richter magnitude scale (ML) or the moment magnitude scale (Mw), or the surface wave magnitude scale (Ms) for very old earthquakes. The present list is not exhaustive and reliable and precise magnitude data is scarce for earthquakes that occurred prior to the development of modern measuring instruments."
Debunked?
0 -
My thinking, was, people would have a way to distinguish between a purely negative voter and a broadly fair or positive voter; however I think your objection to my idea is equally plausible (slightly differently maybe) in your scenario, so perhaps this idea is just a dead end.
There are times when I suspect a third party downvote is given for personal reasons rather than content reasons (some people just can't let go
) at situations where a clever barb or saying nothing would be more appropriate. They have a "My team against yours" mentality. The opportunistic down voter. Spectator hooliganism, thats what it is! I'll bet that metric would show on some individuals as a higher than average total if a negative vote per post was tallied. Sort of a pin the tail on the donkey metric. 0 -
That’s a good idea but only if there’s also a positive counter.
I don't know about that one. I'm kind of wanting to have certain individuals who I see as rather loose, or is it generous, with the downvote button to see the metric of their ways. A "I give the most up votes" contest could really diminish the value of really deserving one. Kind of like printing too much money and getting the inflation as a result, lowering the value of the individual dollar (up vote).
It could be the date of the last downvote given.
Maybe a counter under a fitting motto like: Credo quia absurdum
0 -
The funniest problem is when a member creates a new account for the sole purpose of giving themselves reputation points, as if meaningless Internet points are sufficiently meaningful for that to be worthwhile.
I made up a game for that once. Back when Pure Genius was up voting himself every day I enjoyed going all Wack-a-mole down vote on his thread. It was great fun!
You know, I don't think I have down voted anyone since then. Could we have down vote counters next to our avatar? That would shake things up.
0 -
Obviously you have the only correct view so I bow to your brilliance. How stupid and impudent of me to have questioned it. I'll just return to the ill begotten hole I climbed out of and self-flagellate for my transgressions.
Cool, when did we get a drama dept. Lets do Shakespeare next! My turn, pretend I sound like Patrick Stewart!
Now is the winter of our discontent. Made glorious summer by this sun of York; And all the clouds that lour'd upon our house. In the deep bosom of the ocean . . . . . .
0 -
It would sell better if it sounded like the bikes from the TRON movie, although someone else has already built an electric version of the Tron bike this Harley would definitely be more comfortable and practical.
1 -
I read the first page and it is nothing but complaints against the establishment
Are you referring to the first page of Mantle plumes ? - http://www.mantleplumes.org/
The contributors are scientists from both sides of the debate. Dr. Anderson is part of the establishment. I don't follow your reasoning.
As he did and as the zombie guys have done, you should do.
You have miscategorized Dr. Anderson and his contributions to that site. As for "going on the road", I have two sites on weebly and a SFN blog. I'm here because it strengthens my model to debate it. The feining and avoiding materials like that of post #275 are apparently par for the course though. There is, to say, a lot of time spent by certain individuals to concentrate on what they perceive as low hanging fruit, not willing to risk attacking the material in posts like #275.
0 -
I sense more than a hint of a Galilean complex going on with you here... you alone against the establishment. I don't have a horse in this race and am really quite ignorant of the subject matter so don't have an opinion either way but this does stick out to me.
You are probably right. It seems to eventually develop in some threads where there is a large disagreement between individuals. I have a feeling that has been slowly developing for over a year, that no matter how good the evidence I post, it will be ignored. Post 275 is a good example. No comment? Too much for someone to deal with?
They take the "pretend it doesn't exist" tactic and keep banging away at the tattered edges where perceived weaknesses are. Thats OK for awhile but there is some "pretending to not see the connection" going on here.
That post above, #311 by Billiards is a cut and run. He didn't like me showing in the preceding post how weak his standard model is. The long list of inventions to fix it's problems.
And again, he didn't understand my model so he didn't like the detailed answer I gave;
"So you can't imagine the mantle could sustain the strain energy response's for millions of years as a sawtooth incline, huh. That the fraction of a degree rise over millions of years could contain short periods of reduced or increased energy. The "tooth" containing frequencies or pulse cycles of strain energy releases or reductions of them. The spacing between them controlling the variable content amounts. A Glacial would be widely spaced intervals and an interglacial would be closely spaced having the higher thermal content at the crust/mantle boundary.
This is a solar magnetic phenomena containing electromagnetic frequencies. The closer together they are the more heat will flow into the ocean causing the climate temperature to increase slightly. The earthquake periodicities would also increase as the largest plates telegraph the mantle's more frequent strain energy cycle. Like is happening now.
. And then, as their timing slows the heat content to the ocean would decrease causing cooling of the climate while the earthquakes decrease. The holocene's Bond and Dansgaard-Oeschger events of the last glacial occurred at quasi 1470 year periodicities and would be a result of these frequencies along with the Little Ice Age, the 8.2 kiloyear event, and the Younger Dryas."
Another post ignored with a dismissive comment and a quick exit. If you can't deal with the answers don't ask the questions. And looking like you are too afraid to tackle posts like #275 doesn't help.
Reading the first page of Arc's last proffered link, I see those authors taking the same tack. (Get it? Horses, race, tack?
)Do you know about the author of that link? He is a major contributor to that site.
http://www.seismolab.caltech.edu/anderson_d.html
Don L. Anderson EMERITUS PROFESSOR
Eleanor and John R. McMillan Professor of Geophysics, Emeritus
Ph.D., 1963-2002
California Institute of Technology
Seismological Laboratory
1200 E. California Blvd., MS 252-21
So. Mudd Building, Rm 263A
Pasadena, CA 91125
Email: dla@gps.caltech.edu
Website: http://www.gps.caltech.edu/~dla
Research
Interpretation of deep Earth seismic data, including tomography, to derive models for the composition, physical state and evolution of the Earth's interior; derivation of global geodynamic models; synthesis of geochemical, geophysical and geodynamic data; interactions of lithosphere and asthenosphere.
Past
Director, Seismological Laboratory, 1967-1989
Acme, believe me, Billiards knows the weight of this man's words. Dr. Anderson is not one to be disregarded. And that site is for discourse regarding the related phenomena. It is filled with material by topnotch scientists.
-1 -
I love it because I read the whole paper and as I pointed out before to you the author says we need to know more about how Earth's rotation influences convection in order to account for the apparent discrepancy.
And you do understand that mantle convection and mantle plumes are completely hypothetical inventions with absolutely no verifiable evidence that they exist. So you can modify them anyway you want within reasonable parameters because you are not burdened by the pesky demands of having to have or maintain verifiable observations.
When convection could not produce the needed answers they invented plumes. Then plumes lead to . . . . . .
http://www.mantleplumes.org/Zombie.html
"Rationalizations of the observed characteristics of hypothetical plumes have generated continuously changing predictions regarding fixity, hot-spot motion, age progressions of island chains, heatflow, style of mantle convection, uplift prior to magmatism, temperatures of magmas, and geochemistry. These predictions are rarely successful, so the concepts have been modified to allow as many exceptions, and as many kinds of plumes, as there are "hot spots". The guiding principles are non-physical. The products of plumes are whatever is observed where plumes are postulated. Amendments to the fixed "hot spot" hypothesis now include mantle winds, polar wander, mantle roll, lithosphere drift, lateral flow, magma tunnels, group motions of "hot spots", plume head decapitation and superplumes. Mantle winds are used to explain non-fixity of "hot spots". “Fixed hot spots" may be large regions or long "hot lines" within which volcanoes can pop up anywhere and in any sequence. Plumes are postulated to feed volcanoes thousands of kilometers distant, and they no longer need fit Euler geometry or global reference frames. If age progressions are non-uniform, new co-linear plumes are added. Most “plume tracks” are missing a “plume head”, and most “plume heads” are missing a track. The lack of evidence for “plume heads”, “plume tracks”, high heatflow and precursory uplift is ignored or rationalized. Evidence for the uplift predicted to precede the Siberian flood basalt is assumed to be hidden beneath the west Siberian lowlands, whereas that for Hawaii is assumed to have been subducted. Findings that defy such ad hoc adjustments became official paradoxes: the Lead Paradox, the Helium Paradox, and the Heat Flow Paradox. New observations are labeled surprising, unexpected, counter-intuitive or anomalous."
It's all hypothetical.
I also suggest -for the 3rd time- that you write to that very author and give a summary of your ideas and ask for his input. Given that you cite him as an authority that supports [some aspect of] your hypothesis, contacting him for his affirmation/approval seems only logical.
Adding one more preoccupied Geoscientist who would be unwilling to invest the time to understand this idea would not be any more productive than the current situation.
If you think you can expand the core by >30% with less than 1 degree of heating then you are living in "cloud cuckoo land."
I'm sorry but I'm thinking that you're a little too biased to really give fair analysis. You just go in blasting away and as I noted above, it appears you didn't even know enough about the model to evaluate accurately.
Take another look at that link above and that quote. That is a mess of fixes to keep convection and plumes viable, and then add to that the Carlo Doglioni critique. Its hard for me to take your criticism with any gravity. You don't seem concerned at all about any of the material showing how much the standard model is and has been in, as you say - "cloud cuckoo land." . You appear to have bought into it pretty deeply and give it a free pass.
You still have not dealt with the 14C, climate, and earthquake evidence I have posted. On page 14 post #275 is material that no one has tried to challenge. You and everyone else have avoided it and ignored all my attempts to prompt and even provoke someone to challenge it.
iNow challenge;
"Can you demonstrate there has been a significant shift in tectonic dynamics since the industrial age, a shift that could account for the warming trend we're seeing and that is somehow different than shifts that have taken place through the last several thousand years?"
And I demonstrated exactly that word for word. Any comment? Challenge?
I didn't think so.
Well then your whole "climate argument" falls by the wayside -- if you insist on millions of years time scales then you can't explain processes operating over tens of thousands of years. You can't have it both ways.
So you can't imagine the mantle could sustain the strain energy response's for millions of years as a sawtooth incline, huh. That the fraction of a degree rise over millions of years could contain short periods of reduced or increased energy. The "tooth" containing frequencies or pulse cycles of strain energy releases or reductions of them. The spacing between them controlling the variable content amounts. A Glacial would be widely spaced intervals and an interglacial would be closely spaced having the higher thermal content at the crust/mantle boundary.
This is a solar magnetic phenomena containing electromagnetic frequencies. The closer together they are the more heat will flow into the ocean causing the climate temperature to increase slightly. The earthquake periodicities would also increase as the largest plates telegraph the mantle's more frequent strain energy cycle. Like is happening now.
. And then, as their timing slows the heat content to the ocean would decrease causing cooling of the climate while the earthquakes decrease. The holocene's Bond and Dansgaard-Oeschger events of the last glacial occurred at quasi 1470 year periodicities and would be a result of these frequencies along with the Little Ice Age, the 8.2 kiloyear event, and the Younger Dryas.
But through this process the average content would increase or decrease with the solar magnetic/ planetary magnetic record previously discussed.

"I admire your enthusiasm, but you are not doing science. I'm sorry. But it is true. You are not a scientist as you yourself say, so I do not see this as a weakness in you. It is a great strength that you have the imagination to do this. Your weakness is that you really believe you are doing science. Please, take the time to learn the science from the experts, challenge all you like but listen. Develop your idea, and develop it scientifically. Try to prove yourself wrong, listen to criticisms, build. Who knows, maybe this idea doesn't work, but if you keep challenging yourself, you might find yourself publishing something RELEVANT in a bonafide scientific journal one day."
And you may not notice that you have been co opted to see things in a certain way. You were trained by someone who was trained by someone else. There was a process that required and still requires you to do things a certain way, you were told what was important and what was not. There has been pre programming in the way you think and do science since your early education.
But you do not see this confirmation bias, it is how people everywhere operate. Scientists are not immune to its influence.
If this model didn't have all of the predictions of observations I would not be here because I would know the model was not any better than what is already out there. I'm here because it does explain phenomena, you might not like it or agree with it but that's life in a free market of ideas.
-1 -
Hi Billiards, long time no see. Hey, I was kind of hoping you would have used that time away to see if you could come up with even one prediction of observation that would even remotely resemble the observable natural world.
You know, like;
"This mantle plume did this and it made this oceanic plate do that" . . . . . or . . . "This decapitated plume head is causing this to move because we can see right here in this data it is increasing and going to do this because there's no other explanation" . . . . . .
But we both know you can't make any predictions of observations with YOUR MODEL because . . . . .Drum roll please! . . . . . . . . .
http://www.dst.uniro...antle_Dynamics_
"At the moment there is no way to link mantle dynamics and plate kinematics at the surface". . . . . . . . "In other words, mantle convection alone seems not able to generate plate tectonics."
Damn, I bet you love reading that!
So its kinda funny you have such an interest in knocking someone else's model. Hmm . . . . . . This isn't hypothesis envy is it?
You and I and anyone who reads that link up there knows your model can't do crap, you have no predictions of observations to show for how many years you been doing whatever it is you do. So it kind of looks like you came over here to kick someone else's work out of spite.
+1
And furthermore the picture looks bleaker when we consider it is the difference in energy that is important. A qualitative consideration should be sufficient to highlight the concern:
Question: How much energy would it take to raise the temperature of the core by 1 degree?Did I say 1 degree? I don't recall ever saying 1 degree.
This is the my opening post for this thread.
arcPosted 18 March 2013 - 09:29 PM
. . . . So I started with a simple model, just a divergent plate boundary, a plate and a convergent boundary (trench). The cycle begins with a small thermal increase in the molten iron core from increased current due to induction from the strengthening of the Sun's magnetic field.. . . . . .
Nope, no 1 degree there.
This is my second post of this thread.
arcPosted 19 March 2013 - 10:09 PM
Lets imagine that there is a small current/temperature variable over millions of years in the Earth's magnetohydrodynamic field generator ( that could and probably would also be expected in the current standard model I think) and it slowly raises the outer core's temperature a fraction of a degree over those millions of years. A fraction of a degree over millions of years. I believe almost everyone would expect the liquid outer core to thermally expand a proportionate amount to the degree of temperature rise.
Well look at that! No 1 degree there either!
I do say a fraction of a degree though. But its spread out over millions of years.
I'm not a scientist but I know there's a big difference between one degree right now and a undefined fraction of 1/100 or is it 1/1000, or whatever it is when it is finally defined, over millions of years.
So, are you just trying to mislead everyone as to what I have said, or is it you have just not taken the time to learn anything about what you are criticizing?
You know this is not an easy thing to do, to come up with an original idea that could be a scientific breakthrough. You have to be a little loose to start with and then tighten up the concept as you learn the boundaries of the phenomena you are dealing with.
Kind of like convection theory computer simulations;
http://www.mantleplumes.org/Convection.html
"Materials usually expand when heated. This causes them to rise when embedded in compositionally similar material. Pressure drives atoms closer together and suppresses the ability of high temperatures to create buoyancy. This is unimportant in the laboratory but it also means that laboratory simulations of mantle convection, including the injection experiments used to generate plumes, are not relevant to the mantle. Unfortunately, computer simulations are generally used to confirm the laboratory results and, when applied to the mantle, also ignore the effects of pressure on material properties. In fact, the effects of temperature are also generally ignored except the effect of temperature on density. This is called the Boussinesq approximation. This works fine in the laboratory, but does not apply to the mantle."
Hmm. . . Looks like you guys are a little loose with the parameters. Wouldn't you say?
2) Complete melting of the mantle.
If arc's hypothesis is that these changes are important over the 1000s of year timescales in which climate variations have been observed, then this heating must happen very quickly, and indeed, the cooling must also happen very quickly. But the mantle is a very poor conductor of heat. So arc's theory cannot be right unless a mechanism for very rapid cooling is invoked. No such mechanism exists. Even if the core could lose this heat somehow, the mantle would still be burdened with it, and inevitably it would get so hot it would eventually completely melt. This is not the case as clearly observed by the propagation of shear waves through the mantle.Again, are you being dishonest or criticizing something you don't bother to understand?
This is what I have always said:
This part is really important to note. This heat is not migrating from the core, which would take considerable time. This thermal content is produced at the crust/mantle boundary. The mantle makes up 85% of the Earth's volume; its thickness requires its outer surface to expand in proportion to its distance from the core creating tremendous strain energy in very small amounts of outer core/mantle boundary displacement. This mechanism connects the strain energy response to the magnetic field variability in almost synchronous timing.
Again, are you being dishonest or just criticizing something you don't bother to understand?

The thermal content that is seen in this graph as the Medieval Warm Period and the current warming since the Little Ice Age is made at the crust/mantle boundary by strain energy as the mantle is displaced, it does not migrate or convect from the core.
http://solidmechanics.org/text/Chapter4_3/Chapter4_3.htm
"A representative spherically symmetric problem is illustrated in the picture. We consider a hollow, spherical solid, which is subjected to spherically symmetric loading (i.e. internal body forces, as well as tractions or displacements applied to the surface, are independent of


 and
and 
 , and act in the radial direction only)".
 Again, it's made under the crust, under the oceanic plate where it can pass into the ocean at divergent plate boundaries and hydrothermal vents.
What I think would be fair is you guys, Acme, Billiards, iNow, start coming up with alternate explanations for the very accurate observation that this model makes.
Really, it's that simple.
iNowPosted 14 June 2014 - 05:32 AM
"Just because there were different causes of climate change in the geological past doesn't mean that human activity cannot be the primary cause today. Your basic logic above is inherently flawed."Really!How about you explain why this model can predict the solar magnetic increase proportional to the climate warming since The Little Ice Age. And can further predict why and how the Pacific plate's proportionally larger plate movement is causing simultaneous earthquakes, in proportionally increasing numbers, simultaneously with the solar magnetic and climate values.You're just throwing rocks at something you won't even attempt to understand, and further, ignoring its ability to accurately predict surface geology and climate history.Until you can do that you guys are just blowing smoke. Quit babbling and come up with some answers!Seriously! Put up or shut up!0


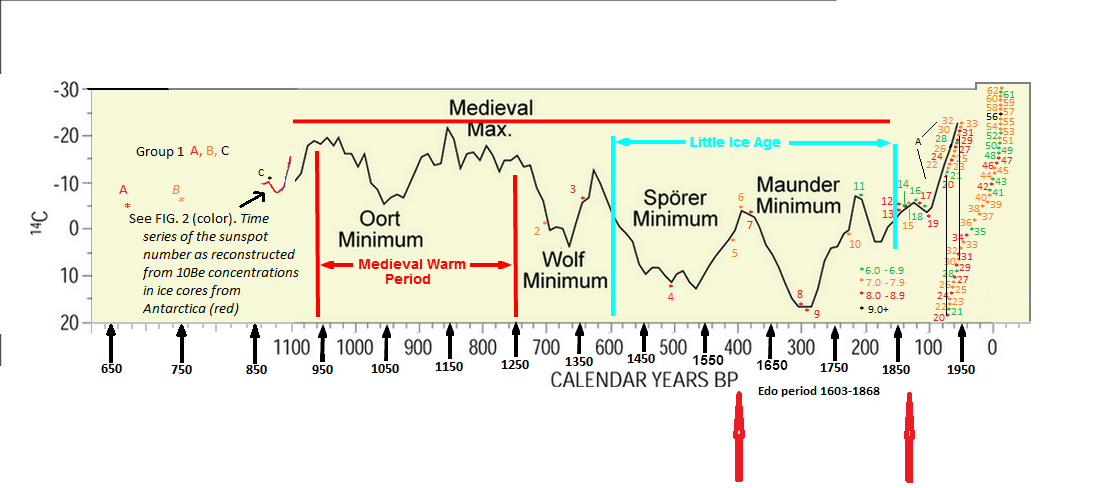

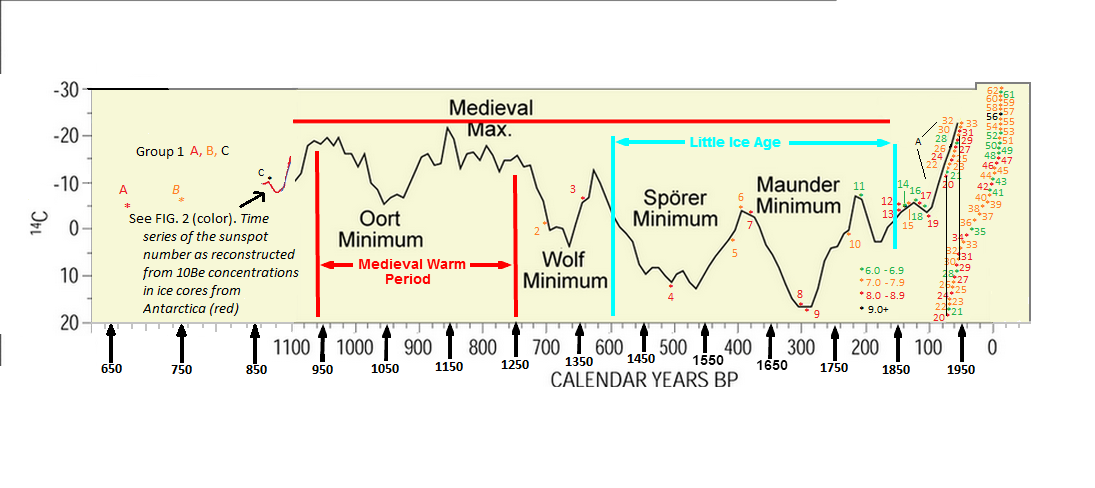


Plate tectonic mechanism ?
in Speculations
Posted
In case you didn't read my response to Acme I will repost it for you because it explains the observations so perfectly. The model once again makes predictions of observation far better than you have ever seen or could ever hope to make with your convection model.
When you get a chance maybe you could explain why the solar magnetic flux, climate temperature and earthquakes are all correlated, in not only timing, but intensity also. In 1707 the strongest quake in recorded history, up until the 9.0 in 2011, occurred during a 20-30 year period when the solar magnetic flux was at its lowest recorded point called the Maunder Minimum. This was also when The Little Ice Age was in full swing.
So, the model says; as the solar magnetic flux increases the mantle will be displaced, and in turn will open the divergent boundaries, warming the ocean thermohaline and in turn the climate. And when this process is reversed and the solar magnetic flux decreases the mantle subsides, and in turn the divergent boundaries will slow and even stop, and the oceans will cool, pulling the climate down to colder temperatures. During this time the crust is of course being compressed by the previous boundary infill on one side and the convergent trench on the other.
So now you should understand why at that low point of solar magnetic flux there was a low point in climate temperatures while there was also one of the largest earthquakes . . . . . .or it could be just another one of those three way coincidences that are always happening.
#9 on the graph is;
http://en.wikipedia....Åei_earthquake
The 1707 Hōei earthquake, which occurred at 14:00 local time on October 28, 1707, was the largest earthquake in Japanese history until the 2011 Tōhoku earthquake surpassed it. It caused moderate to severe damage throughout southwestern Honshu, Shikoku and southeastern Kyūshū. The earthquake, and the resulting destructive tsunami, caused more than 5,000 casualties. This event ruptured all of the segments of the Nankai megathrust simultaneously, the only earthquake known to have done this, with an estimated magnitude of 8.6 ML. It might also have triggered the last eruption of Mount Fuji 49 days later.
"This point is one of confusion for arc, so let's break it down:"
"1) Does the mantle convect?"