
Doogles31731
Senior Members
-
Joined
-
Last visited
Everything posted by Doogles31731
-
I have been an aficionado of boxing since I was an early teenager, and it looked liked a staged slap to me. Will Smith went through the motion, but he put no power into the contact. Chris Rock's head didn't move, nor did his expression change. It didn't fulfill Koch's postulates.
-
If you can apply a measurement factor to any biological property of plants, I would have thought that any statistics software would suffice, so long as you used appropriate tests for whatever analyses you intend to do. If you can't afford one of the expensive sets of software, Microsoft Excel has a reasonably useful inbuilt statistical software system.
-
Apologies for the length of this post, and particularly if you already know all about the subject. Thanks again Prometheus. Even though you spent only 3 minutes researching, I believe it’s now safe to say that no research group appears to have assessed the effects of high vitamin K supplementation on blood coagulopathies. I couldn’t find any such evidence in the literature and I didn’t want to make such a statement, unless someone else affirmed it. You and exchemist have done so to some extent. I think it is noteworthy that you found references only to low, as distinct from high, vitamin Ks. By 2012, Theuwissen et al (http://advances.nutrition.org/content/3/2/166.full) concluded that there is no such thing as healthy human subjects with fully carboxylated-glutamic acid-proteins outside of the liver and that western diets contained insufficient vitamin K to meet the requirements of healthy bone and vascular wall. This was a reinforcement to some extent of the opinion of Shearer & Newman (2008; https://www.thieme-connect.com/products/ejournals/abstract/10.1160/TH08-03-0147) who stated that data on the bioavailability of the various forms of vitamin K is limited, and that although the absorption of pure vitamin K1 is 80%, the absorption from foods such as spinach is only 4-17% of that absorbed from tablets because of its tight binding to chloroplasts. If those studies are correct, then the comparisons of association with various degenerative diseases in the literature is tantamount to a comparison of low low with moderately low blood concentrations of the biomarkers. As I said in an earlier post, a study of vitamin K and its association with degenerative diseases has become almost a hobby of mine over the last 7+ years. The recommended daily allowance of vitamin Ks (roughly 100 micrograms) is apparently based on the amount required to produce adequate blood coagulation (Shearer et al 2012; https://academic.oup.com/advances/article/3/2/182/4557941).The role of vitamin Ks in blood coagulation is only a part of its usefulness. It plays a vital role in brain development and function (Ferland 2012; https://academic.oup.com/advances/article/3/2/204/4557944) and most importantly in blood vessel health. ‘Low’ vitamin K status has been associated with blood vessel integrity in the form of arteriosclerosis and atherosclerosis (Jie et al 1995; http://www.sciencedirect.com/science/article/pii/0021915095055377; Knapen et al 2015; https://www.thieme-connect.de/DOI/DOI?10.1160/TH14-08-0675; Vissers et al 2016; https://www.atherosclerosis-journal.com/article/S0021-9150(16)31216-3/abstract; Lees et al; 2018; https://heart.bmj.com/content/105/12/938.abstract). And atherosclerosis has been associated with many conditions, including osteoarthritis, coronary heart disease, chronic kidney disease, dementia, atrial fibrillation and strokes. You can check all of the latter simply by using the ‘keywords of the condition’ and ‘atherosclerosis’ into Google Scholar. Although vitamin K is well known as an activator of factors involved in the blood clotting cascade, it is not well known that it also activates at least two anti-coagulant proteins in the form of Protein C and Protein S. After Protein C is activated by vitamin K as a co-factor, it undergoes further activation by combining with a thrombin-thrombomodulin combination, plus its own receptor on the endothelium, to form a very powerful complex known as Activated Protein C (APC), which is further activated many-fold by Protein S. Maruyama (1999; https://www.thieme-connect.com/products/ejournals/abstract/10.1055/s-0037-1615902) in Recombinant Thrombomodulin and Activated Protein C in the Treatment of Disseminated Intravascular Coagulation, explains it in more detail. This APC is intimately involved in controlling the degree to which blood-clotting mechanisms work, as well as preventing several stages of atheroma formation -- it counteracts the vascular adhesive proteins that cause monocytes to stick to the endothelium of arteries; it counteracts the chemattractants that cause monocytes to infiltrate between endothelial cells to lodge in the intima as they differentiate into macrophages and foam cells, and it counteracts some of the inflammatory products of atheroma formation. I uploaded an ultrasound image of reversal of atherosclerosis in my lower aorta in a previous post after taking high doses of vitamin K supplements.. When you consider that we have probably thousands of kilometres of blood vessels, if laid end to end (Blood Vessels | The Franklin Institute (fi.edu)), you can imagine how much APC, and therefore vitamin K, is required for general health, apart from being a blood-clotting regulator. It explains why so much calcification of arteries is associated with prolonged warfarin medication. The following 2021 references are just a few: Elango et al (2021; https://www.mdpi.com/2073-4409/10/4/773) in The Effects of Warfarin and Direct Oral Anticoagulants on Systemic Vascular Calcification: A Review concluded -- “ ... Established adverse effects include bleeding, skin necrosis, teratogenicity during pregnancy, cholesterol embolization, and nephropathy. One of the lesser-known long-term side effects of warfarin is an increase in systemic arterial calcification. This is significant due to the association between vascular calcification and cardiovascular morbidity and mortality. Direct oral anticoagulants (DOACs) have gained prominence in recent years, as they require less frequent monitoring and have a superior side effect profile to warfarin, specifically in relation to major bleeding. ... “ Vernados et al (2021; https://www.sciencedirect.com/scienc...03497521007268) in Warfarin Induces Calcification of the Aortic Valve Through Extracellular Signal-regulated Kinase 1/2 and β-catenin Signaling Sadioglu et al (2021; https://journals.tubitak.gov.tr/medi...t.htm?id=30049) in Warfarin is associated with the risk of vascular calcification in abdominal aorta in hemodialysis patients: a multicenter case-control study Van den Bergh et al (2021; https://www.mdpi.com/1422-0067/22/21/11615) in Endothelial Contribution to Warfarin-Induced Arterial Media Calcification in Mice Nuotio et al (2021; https://www.frontiersin.org/articles...21.696244/full) in Warfarin Treatment Is Associated to Increased Internal Carotid Artery Calcification van gorp et al (2021; https://academic.oup.com/ehjopen/art...455?login=true) in Vitamin K antagonist use induces calcification and atherosclerotic plaque progression resulting in increased hypercoagulability One of the positives of becoming involved in a forum such as this one is that you can always learn something and it can always stimulate some lateral thinking. When I received a useful research article from exchemist, I noted this statement “Several studies have addressed the effects of supplemental vitamin K on response to warfarin. Thus, single dose administration of a 250 µg vitamin K1 tablet to patients stabilized on warfarin did not result in prothrombin times outside the therapeutic range. However, after 1 week of daily administration of the vitamin, increased doses of warfarin were required in order to maintain the therapeutic range, and doses of K1 tablets at 100 µg day−1 for 1 week caused increased coagulability, but still within the therapeutic range [38].” The danger of warfarin medication is shown by the number of complications involving artery health. It may help prevent clotting, but it also may have a tendency to reduce the activation of proteins essential for brain and artery health. I would think that this idea of supplementation of warfarin with some vitamin Ks is worth further exploration for patients on warfarin. Another aspect that the comments of Prometheus and exchemist triggered laterally in my mind was that APC has been trialed therapeutically in a few conditions. Over 30 years ago, Okijama et al (1990; https://onlinelibrary.wiley.com/doi/abs/10.1002/ajh.2830330413) in Treatment of patients with disseminated intravascular coagulation by protein C, described its successful use on three cases of disseminated intravascular coagulation in which heparin was not successful. Griffin et al (2002; https://www.sciencedirect.com/science/article/abs/pii/S0037196302500470) in Activated protein 😄 Potential therapy for severe sepsis, thrombosis, and stroke, found that “Activated protein C (APC) reduced all-cause 28-day mortality by 19% in patients with severe sepsis (sepsis associated with acute organ dysfunction) in the Protein C Evaluation in Severe Sepsis (PROWESS) trial, leading to recent approval of recombinant APC for treatment of this condition in adults. This review summarizes current knowledge derived from studies of a variety of animal models in which infused human APC demonstrated beneficial activities. Based on in vivo and also in vitro data, APC manifests antithrombotic, profibrinolytic, anti-inflammatory, and antiapoptotic activities. ... “ But this article suggests a limitation -- Ikezoe (2015; https://link.springer.com/article/10.1186/s40560-014-0050-7) in Thrombomodulin/activated protein C system in septic disseminated intravascular coagulation, summarised that “ ... On the basis of the success of the Protein C Worldwide Evaluation in Severe Sepsis (PROWESS) trial, the FDA approved the use of recombinant human APC (rhAPC) for severe sepsis patients in 2002. However, subsequent clinical trials failed to show clinical benefits for rhAPC, and an increased incidence of hemorrhage-related adverse events was noted, which prompted the industry to withdraw rhAPC from the market. On the other hand, recombinant human soluble TM (rTM) has been used for treatment of individuals with DIC since 2008 in Japan, and a phase III clinical trial evaluating the efficacy of rTM in severe sepsis patients with coagulopathy is now ongoing in the USA, South America, Asia, Australia, European Union, and other countries. ... “ I know that it’s presumptuous for someone who is not involved in a particular field of endeavour to make suggestions in that field, but it does seem plausible to me to provide more blood-clotting capacity to patients if the current medication is causing hemorrhages. You can’t be executed these days for proposing an idea. Or can you??? Rather than just use APC, which must cost a small fortune to prepare, or other anticoagulants for coagulopathies, why not assess high doses of vitamin Ks. There are a number of animal models that could be used for cautious trials. Vitamin Ks are extremely safe (refs can be supplied), cheap and available over the counter. As far as other degenerative conditions are concerned, I must add that during my 7+ years of researching hundreds of therapeutic trials with vitamin K supplements, I have come across only one trial so far that has ensured an adequate vitamin D status in subjects. Adequate vitamin D is necessary for the synthesis of most of the proteins that have to be activated by vitamin K. Another criticism is that most trials have used either vitamin K1 or vitamin K2 instead of both; there is evidence that phylloquinone (K1), for example, will not control atherosclerosis but menaquinone (K2) will; and most trials have used too low a dose of supplements. As a practicing veterinarian for 25 years up to 1980, I never diagnosed a coagulopathy in an animal, but if I did now, I wouldn’t hesitate to supplement it with vitamins D, K1 and K2.
-
Thanks again Prometheus. I'll try this. It will broaden the context. I searched for literature associating vitamin K with deep vein thrombi or emboli without success, and posted in this forum to check whether I had missed something. Can any member of this forum locate any practical research evidence of any kind indicating that vitamin K supplements in excess of physiological requirements will exacerbate any form of blood coagulopathy including deep vein thrombosis, emboli, or disseminated vascular coagulation from any cause? I'm not looking for the theoretical answer that because vitamin Ks activate proteins involved in the cascade of steps involved in the process of blood clotting, that it must be involved.
-
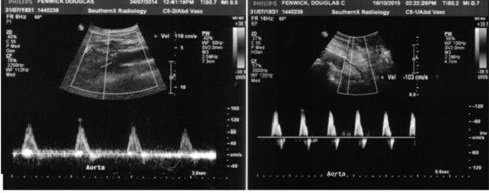
Thank you Prometheus for your time, your consideration and your suggestions. I appreciate your responses. I think some background on my interest in vitamin K will clarify my position. In actual fact, a study of vitamin K and its functions have become something of a hobby of mine over the last seven or so years. I have studied hundreds of articles over this time period and have actually produced a dissertation on the benefits of high doses of supplementation that is totally evidence-based and which contains over 200 hyperlinks to original research. I was on crutches seven years ago because of developing osteoarthritis of the right ankle and heading for a wheelchair. I’ve had bilateral knee replacements for 17 years. I have a stent in a heart artery and a pacemaker for almost as long, and was starting to get mild anginas at the start of exercising, as well as lumbar back pain. Ultrasounds of my lower aorta and bilateral leg arteries revealed that I had extensive atherosclerosis of most arteries and that some were occluded. I received the results weeks before the next scheduled visit to the vascular surgeon who prescribed the ultrasounds, so in the meantime, I began to research all the literature I could on osteoarthritis and atherosclerosis. I discovered that arteriosclerosis and atherosclerosis had been reproduced experimentally in pigs, dogs, rabbits and rats for decades. One study caught my attention. The authors primed rats with high doses of vitamin K and vitamin E prior to experimentation, only to discover that it prevented them from reproducing the condition. My natural consideration was that if these vitamins prevented the condition, they may just have some therapeutic effect. I’d already been taking some Vitamin E. My extensive reading suggested that vitamin K was extremely safe, to the extent that it may be one of the safest substances on the planet, that the recommended daily allowance was far too low, and that for a holistic effect, it was necessary to take both vitamin K1 and K2. I settled on 500 micrograms each of K1 and K2-MK4 for the last 7+ years. My right ankle pain on weight-bearing disappeared within 3 weeks, so the crutches were discarded. My anginas disappeared, as did my back pain. Ultrasounds of my lower aorta and leg arteries 14 months later showed normal tracings for any arteries less than 60% stenosed. Occluded arteries have remained occluded. Although my right ankle recovered enough for painless weight-bearing, both ankles are structurally disgraceful; flattened as in ‘Charcot’s Foot’, and there is still a 2.5 cm osteophyte on the medial aspect of the right ankle. I will attempt to upload an image of the ultrasounds of my lower aorta before and after high vitamin K supplements for 14 months. I believe it is the only evidence in the world of reversal of atherosclerosis. I’ve been trying to rationalize exchemist’s unusual response to my OP, and I believe it may be that I am now on a different page from other people with respect to vitamin K. I have conducted all my own research and experimentation solo by just following the literature references. My own GP changes the subject any time I attempt to discuss it. My cardiologist, foot specialist, pharmacist and other health industry workers all tell me that the vitamin K will ‘thicken’ my blood and cause blood clots. Hence my opening statement. It may be that this mindset may not be present in heath practitioners in other parts of the world. I was thinking about how widely warfarin has been, and still is, used, these days in cases where my research suggests high vitamin Ks should be prescribed. I have so far identified 17 medical conditions associated with low vitamin K status (variously low, moderate or strong associations). Recently I was reading about warfarin and deep vein thrombosis when it occurred to me that therapists would not be using warfarin (a vitamin K antagonist) unless they thought that vitamin K in excess of physiological requirements was associated with that condition. I searched for literature associating vitamin K with deep vein thrombi or emboli without success, and posted in this forum to check whether I had missed something. My dissertation consists of 120 odd pages, so the above just barely touches on the subject.
-
Prometheus, I used Google Scholar with the keywords WARFARIN VS CONTROLS AFTER JOINT SURGERY. I used ANY TIME. You can see that there are few studies comparing warfarin with untreated controls, and there are some doubts about the dose rates of warfarin used in them In addition to the following, two of the other early references showed no significant difference between warfarin and controls when 1 mg per day was used as a fixed dose before and daily for 3 weeks after surgery, but the dose rate was not controlled according to INR. Pinto (1970; https://bjssjournals.onlinelibrary.wiley.com/doi/abs/10.1002/bjs.1800570508) in Controlled trial of an anticoagulant (warfarin sodium) in the prevention of venous thrombosis following hip surgery. “Fifty consecutive patients over the age of 50 years, undergoing hip operations, were studied. Twenty-five patients were treated with warfarin sodium and 25 acted as controls. Nine in the treated group and 8 in the control group developed postoperative deep-vein thrombosis.” Sachs et al (2003; https://www.sciencedirect.com/science/article/abs/pii/S0883540303000718) in Does anticoagulation do more harm than good?: A comparison of patients treated without prophylaxis and patients treated with low-dose warfarin after total knee arthroplasty. Abstract excerpt: “The control group had a total complication rate of 2.2%, with a death rate from thromboembolic disease of 0.0% and a total death rate of 0.2%. The warfarin group had a total complication rate of 4.7%, with a death rate from thromboembolic disease of 0.0% and a total death rate of 0.1%. Both deaths in the control group were from cardiac disease, while the death in the warfarin group was due to a massive gastrointestinal bleeding. The warfarin group had twice the infection rate of the control group.” Ballal et al (2020; https://ard.bmj.com/content/80/5/605.abstract) in Warfarin use and risk of knee and hip replacements. Conclusion “Warfarin, a vitamin K antagonist, was associated with greater risk of KR and HR (an indicator for end-stage knee OA) than DOAC use, supporting the importance of adequate vitamin K functioning in limiting OA progression.” The following article using dextran40 as a control suggests that warfarin was better than dextran40, but I prefer no-treatment controls. Francis et al (1983; https://jamanetwork.com/journals/jama/article-abstract/382260) in Two-Step Warfarin TherapyPrevention of Postoperative Venous Thrombosis Without Excessive Bleeding. This study of patients prone to venous thrombosis, used a course of warfarin for 10-14 days before surgery and used dextran 40 for controls. The clinical results were better for warfarin. Bingham et al (2018; https://www.sciencedirect.com/science/article/pii/S2352344118300475) in A dedicated anticoagulation clinic does not improve postoperative management of warfarin after total joint arthroplasty. Conclusions: “Despite utilization of a dedicated anticoagulation clinic, patients were only within their target INR range 27% of the time. Total knee arthroplasty patients who developed a PJI were more likely to be therapeutic or supratherapeutic in the initial postoperative period. Consequently, the risks associated with warfarin as a venous thromboembolism prophylaxis may outweigh the potential benefits.” This paper suggests that too much warfarin is associated with periprosthetic joint infections. It's hard to draw conclusions from the above literature. Prometheus, you may notice that in the conclusion by Ballal et al above, there is a phrase “ ... supporting the importance of adequate vitamin K functioning in limiting OA progression.” There is mounting evidence that many conditions, including osteo-arthritis, are associated with low vitamin K status. I’ll append a few references to that: Neogi et al (2006; https://onlinelibrary.wiley.com/doi/full/10.1002/art.21735) concluded that there was a significant association between low plasma phylloquinone concentrations and increased prevalence of osteoarthritis manifestations in the hand and knee. Shea and Booth (2017; https://www.sciencedirect.com/science/article/pii/B9780128051863000199) reviewed vitamin K and knee osteoarthritis and concluded that vitamin K–dependent proteins in joint tissues from patients with osteoarthritis were undercarboxylated (therefore less functional), and that lower vitamin K nutritional status was associated with more osteoarthritis. They affirmed in this 2017 review that no clinical trials have yet been designed specifically to test the effect of vitamin K supplementation on osteoarthritis. Kok-Yong Chin (2020; https://www.mdpi.com/2072-6643/12/5/1208) reviewed the literature on Vitamin K status and osteoarthritis and concluded that it generally suggests that a low vitamin K status is associated with the condition, particularly in the elderly, but that sufficient trials have not yet been conducted to determine optimal doses of vitamin K. Laio et al (2020; https://www.oarsijournal.com/article/S1063-4584(20)30836-0/abstract) reported on 213 patients with symptomatic knee OA and low 25-hydroxyvitamin D (12.5-60 nmol/L) who finished the study and who were enrolled and randomly assigned to receive monthly treatment with oral 50000 IU vitamin D3 or an identical placebo for 2 years. Their dietary vitamin K intakes were evaluated, and they were classified as 'high' if above 112 micrograms a day on average or 'low' if below that average. Their baseline WOMAC scores for arthritis were assessed at baseline and after 24 months. The 'high' vitamin K with sufficient vitamin D groups showed significant improvements over their baseline figures for Womac scores in 'Total Score', 'Pain Score', 'Function Score', and approached significance in 'Stiffness Score'. Boer et al (2020; https://www.oarsijournal.com/article/S1063-4584(20)30700-7/abstract) showed that a vitamin K antagonist, acenocoumarol, resulted in a two-fold increase in hip and knee osteoarthritis when used for longer than 100 days. The same effect was not produced with anti-platelet medication. ..................................... It is the sort of literature I’ve listed above that makes me question whether anybody has checked on the association between vitamin K supplementation and deep vein thrombosis. Few of my contacts are aware that vitamin Ks activate two very powerful anticoagulants in the form Proteins C and S.Prometheus, I will put together an answer for you today, but it may take some time and thought. exchemist, I thank you for that reference, and thank you for posting an excerpt of the relevant paragraphs. It appears to be the type of article I was seeking. I will go through it today. The key to whether it answers my OP question or not, lies in what represents 'therapeutic failure'. Whilst I very much appreciate your assistance, I do not appreciate your closing condescending comments. I find that I am very curious by nature and I keep asking myself questions about everything I read. My OP was intended as a means of checking that I had not overlooked something before I drew a conclusion. You are very good as a 'helper', but please don't become a 'knocker'. It detracts from your obvious skill as a locator of references.Prometheus and exchemist, I thank you both for your references. I'm familiar with all of that work and I have no problems with it. I may not be expressing myself properly. So I'll have another go. For anybody to use a vitamin K antagonist (warfarin) in order to prevent post surgical emboli or deep vein thrombosis, there has to be an assumption that vitamin K is intimately involved in the process of these conditions. At this stage, it appears to be an assumption only, based on the knowledge that vitamin K activates a number of proteins involved in the blood clotting process. I'm searching to see if anyone has conducted an experiment of any kind to see if they can reproduce emboli or deep vein thrombosis in any animal with higher than physiological doses of vitamin K1 or K2 under any circumstances, with or without surgery in any species. And so far it seems safe to say that no such study has been conducted. I've researched a few studies on the post-operative use of warfarin. RCTs using warfarin vs untreated controls are rare. A couple indicate that there is no significant statistical difference in the number of deep vein thromboses. Maybe I have missed a very good RCT somewhere. I'll have another look tomorrow. Off to bed now.I used the term 'in excess of physiological requirements". But I'm happy enough to say that people on warfarin are advised not to take vitamin K supplements. It seems self-evident to me that warfarin is used to suppress the activation of blood clotting by vitamin K. I assume that this would be to reduce the chances of emboli or deep vein thrombosis, the belief being that the presence of vitamin K is a contributor to both. And obviously that amounts in excess of physiological doses would be ill-advised. But I cannot find any evidence in the literature supporting this contention. Hence I'm checking whether I'm missing something that others may know about.exchemist -- I thought it was general knowledge now that warfarin prevents vitamin K from activating blood clotting factors in the liver and that people on warfarin were advised not to take vitamin K supplements in excess of physiological requirements. It has been used for decades as a routine after major surgeries. My problem is that I cannot find any basic literature associating vitamin K supplementation with the formation of emboli. Sensei -- What you've referenced probably applies to most substances. Can you find any evidence for toxicity of oral vitamin K1 or K2 to any animal or human being? I emphasize oral vitamin K1 or K2, because I know there were some problems with a synthetic vitamin K3 (menadione) and there were some allergies to the base used in some injectibles.There seems to be a general belief within the Health industries that doses of the vitamin Ks in excess of physiological requirements, will cause or facilitate emboli of the lungs, heart or other tissues. I’ve been unsuccessful in finding any evidence to support this, yet it is the basis of the worldwide use of warfarin as an anticoagulant. I’m looking for solid evidence that excessive vitamin K causes problems, with the emphasis on excessive. Please don’t supply references to the normal role of vitamin Ks in blood clotting. If you do find such a reference, would you please highlight the excerpts that support that belief. I would like to scrutinise such evidence, but so far, I have been unable to locate any. Thank you in advance.Where were these 'few' who could see the light if there was no earth and sky?Where was God living if there was nothing?SwansonT, studiot, and joigus, thank you for your responses. I studied all of the references you suggested, but unfortunately, the mathematical equations were beyond my comprehension. I was left with just general impressions. ............................................................ SwansonT, my minor problem in response to a question by studiot, wasn’t an understanding of the 15 degrees C and the -18 degrees C, but the reference to how the -18 degrees C was calculated. You at least gave me a source for that. and I thank you accordingly. I can understand that our atmosphere discharges some heat energy into space and that this probably conforms to some extent to the SB Law. This student is dumber than you imagine, and can only understand the very basics. ...................................................... studiot may have provided a better understanding for me concerning the role of SBL principles within our atmospheric dynamics. He points out that “There are two coefficients called emissivity and absorbitivity which relate to energy in the general case and heat in a particular case...... All bodies are in a state of both continual emission and continual absorbtion.” He suggests that a grey body is an imperfect black body; i.e., a physical object that partially absorbs or emits incident electromagnetic radiation. So, in one sense he seems to be suggesting that the SBL is not restricted to ideal black bodies and that virtually every body at molecular or macro- level can be regarded as an emitter or absorber to some extent, depending on temperature and other factors. Now I may have totally misunderstood studiot, and misquoted him, but it is becoming obvious to me that I’m not going to be able to satisfy my curiosity about climate science matters by persisting in this thread. ..................................................................... joigus spoke about ‘periodicity’ or lack of it, being the aspect that I’m missing in the whole picture. To some extent he re-inforces studiot’s notion when he states “Indeed, the Earth is not a black body, but you can rest assured that the part of the radiation spectrum from any physical body that contains thermal information about that body (that is, excludes reflected light, or light that goes through it) nicely fits that of a black body. A black body does not reflect any light, that way you get to the part of radiation from anything made of atoms that's only due to radiation having been in thermal equilibrium (or bouncing around long enough inside the body) and then started to re-radiate those photons. Most of the light you receive from a rock that's sitting on your desk is reflected light. Certainly the one in the visible frequencies is (at room temperature). But if you were sensitive enough to see the infrared, you would see a frequency-dependent graph that agrees with the black-body spectrum.” ............................................................. My thinking about climate change commences basically with my own mental images initially of temperature-recording devices in Stevenson Screens on land, in ships and buoys, and in satellites. I picture the gases in the atmosphere around the land and sea becoming active due to absorbed energy at the molecular level and transmitting emitted energy to the temperature sensors. To my mind, that is what climate change is all about. If the average global annual temperatures weren’t rising due to increasing energy fluxes at the temperature-sensing device mechanisms, there would be no problems associated with ‘climate change”. I can understand the science of how the the energy reaching the surface from the sun and radiative forcing appears to be calculated as a global average at about 156 Wm-2, and how this results in a change in the Earth’s near surface annual average temperature from 255 K to 288. If it’s mathematically incorrect to equate that 33 degrees K with the 156 Wm-2 affecting the atmosphere near the temperature-recording devices, my question would be whether there’s a more complicated mathematical connection, or is it an indirect association. I’ve not received an answer that I can comprehend. I’m unable to glean that from the answers I’ve received, so my curiosity has turned to confusion. I’ve concluded that I can’t learn any more in this forum about the basics. I concede that the reason is most probably my own inability to comprehend the mathematical equations used in the science you’ve all provided but I thank you for your efforts. I’ve decided to retire from this thread because of my own inability to comprehend the responses you have all made in an effort to satisfy my curiosity. I repeat that I thank you all for your efforts..i watched a film called “Get the gringo”, the other night, and your last post, SwansonT, sounds as if it should have the title of “Get Doogles31731”. You’ve certainly done a number on my “science”, and you’ve been supported from the stands by at least 3 grandstanders shouting “Ole”. Anyhow I’m old enough and ugly enough to take it. I’m just thankful that it’s not legal to burn heretics alive any more. ‘ SwansonT, I will deal with just one item in your last post, viz “ On 2/4/2022 at 4:35 PM, Doogles31731 said: If 156 Wm-2 is reaching the surface and near-surface temps are measured 4 feet of the ground, then each 1 degree C in the shade equates to 156/33 Wm-2, which equates to 4.7 Wm-2 per 1 degree C at the surface. If you had looked at the Stefan-Boltzmann law, you would see that radiated power is not linearly proportional to temperature - it depends on T4. Your use of a linear relationship is incorrect. The number is wrong (except at some specific temperature, where it will be approximately correct), and the idea that a power will have a constant relation to a temperature change is also wrong.” The fact of the matter is that I did not know what the Stefan-Boltzmann Law was when you first mentioned it, so I looked it up, only to find that the Stefan-Boltzmann law is a statement that the total radiant heat power emitted from a surface is proportional to the fourth power of its absolute temperature. The law applies only to blackbodies, theoretical surfaces that absorb all incident heat radiation. I have admitted my ignorance. So naturally, I asked you how that Law applies to climate science, and this is your first reply to that question. When I divided 156 Wm-2 by 33, I can see now that I made an assumption that the temperature association with the energy at the level of the recording temperature gauges was linear. I used the wording that each degree C equates to 4.7 Wm-2. Please accept this queation in the spirit of a student seeking information from a teacher. Can you, or anybody else, explain how the Stefan-Boltzmann Law applies here. What exactly are you regarding as the energy emitter in the system, and what are you regarding as the black body? This is meant as a question from a curious person and not someone trying to be a smart arse. I’m interested in any opinions. I could guess that the emitter is the radiative forcing and that the black body is the surrounding environment (including the temperature recording devices.) But that’s only a guess. The reason I ask is because I’m having trouble imagining how it applies. If I use the reference supplied by TheVat of a figure of a 1.6+ Wm-2 increase in radiative forcing from a doubling of CO2, it would that mean that the temperature of the atmosphere has increased by the fourth root of 1.61 degrees C. That would be just over 1 degree C, and sounds as if it’s in the current ball park expected figure. But if the increase of radiative forcing was theoretically 20 Wm-2, it would arrive from a source whose temperature had gone up 1.45 degrees C, the 4th root of 20. If it went up 50 Wm-2, the temperature rise causing it would be 1.63 degrees C. As I said previously about my maths, “Nah, that can’t be right.” You must have a different scenario in mind. I don’t mind being wrong, but I like to know why I’m wrong. Would you, or anyone else, mind giving me a hint as to what is regarded as the emitter and what is regarded as the ‘black body’ within the atmosphere that is explained by the Stefan-Boltzmann Law?studiot, I may have misinterpreted the basis of your question, but I did find a reasonably good site that explains the processes of obtaining, collating and publishing average global temperatures -- https://www.carbonbrief.org/explainer-how-do-scientists-measure-global-temperature. Apparently 4 different bodies are actively engaged in this. It's roughly 15 degrees C at present. If you are talking about the estimation that the Earth would have a temperature of -18 degrees C without an atmosphere, I'm not sure of that, but it could be researched. The net effect is that our atmosphere seems to be responsible for a gain of c33 degrees C. My apologies for wasting your time if you were looking for something else.Joigus, thank you for your response. But I'm left a little confused. In the graph you displayed, the value 'r' represents the correlation coefficient. In that case, it was a high 0.87. To my mind, there were only two variables -- one was the temperature and the other (a single figure), was the sum of 1. The Sunspot Cycle, 2. Dust from volcanic explosions, 3. The el-nino southern oscillation, and 4. The atmospheric CO2 build-up. I was curious as to how that latter figure was derived. After all, a correlation coefficient (0.87) was provided as if a comparison was made between two variables only. There are no error bars in a correlation coefficient. My own attitude to correlations is that a low 'r' indicates that there is probably no connection or interaction between the the 2 variables being compared, but a high 'r' suggests that there could be an association between the two variables directly, or a common association with another third variable. I hope this response was what you were asking, but like you, I'm not sure whether I've misunderstood the point you were making. ........................................................................ SwansonT, I'll take a bit more time to respond to your last comments about my postsJoigus, I'm extremely impressed by that 0.87 correlation between real and predicted temperatures using just 4 variables. Do you have a hard reference to that work apart from what I imagine was a video. That's the sort of result that impresses me. I'd also be curious to know if they could arrive at a climate sensitivity figure using that model.As I said, if Scafetta is correct, then it changes the whole precept, and if he's wrong, then it adds to the inconsistencies in climate science. The Journal he published in was peer-reviewed. ........................................................ On the matter of which came first (a la The chicken or the egg) This site shifts the array of figures on a spread sheet I presume and shows that the best correlations between temperature and CO2 concentrations occur when correlations are performed on the CO2 data lagging a year behind the temperature -- https://www.researchgate.net/figure/Correlation-coefficients-for-different-values-of-array-shifting-for-CO-2-concentration_fig2_242129349. I have no idea why the graph is upside down. This site -- http://climatecat.eu/ufaqs/5-why-does-co2-lag-temperature/ shows a lag in CO2 up to hundreds of years after temperature rises, but the author goes on to say that it’s because the temperature rise releases CO2 from the oceans and then this in turn cause further delayed temperature increases. The hypothesis doesn’t stand up when the temperatures are decreasing. You be the judge.I'm glad you've had a change of opinion. The assumptions being made were way off the mark. I belong to no group. I do not have an agenda. I'm curious about all things and I like to get notions straight in my mind. I find that I understand things better if the basics are correct. I like to understand the basics. I have had doubts about the basics of climate science since James Hansen's first proclamations in the 1980s. I was looking for the answers that came up in response to mistermack's question. I believe it's a very pertinent question, but I'll leave it for others at this stage. I think it happened somewhere between Tyndall and Arrhenius, so I'll be interested to see what other posters come up with. I think an answer will come out of the Wikipedia researcher's story on Climate Change. Meantime I have provided the link to a 2019 paper above that not only cites a questionnaire providing evidence that many meteorologists have doubts about aspects of climate science, but which also provides evidence that current models do not fit the ice-core temperature trends during the Holocene. The author has created a new model to accommodate that basic data. The source of that data in the reference list was from a 2013 source, but I found a 2018 reference showing a very similar graph when the data from 6 separate Greenland Ice Core Site samples were grouped. So I'm satisfied with that author's basic data.That's okay. But I would like to see a serious answer to mistermack's question. I'm curious about the answer myself. And I think it's a fair enough question.Ken Fabian, and beecee, your answers do not fit mistermack’s question “OK. What is the biggest and best piece of evidence you can quote me, for CO2 causing a warming disaster this century?” Serious droughts have been very common in Australia’s history -- See https://en.wikipedia.org/wiki/Drought_in_Australia ..................................................... SwansonT, you are a genius. I typed several computations of that title into Google Scholar and PubMed looking for the original article, without success, but it never occurred to me to use Google and look for images. Thank you. You and exchemist have been very helpful with references for a curious person such as myself and I have used the green tick for both of you accordingly. Although I must add that exchemist has made some badly mistaken assumptions about my motives in my posts. Like TheVat, I have taken a passing interest in Climate Science for a couple of decades now and have not been happy with many of the inconsistencies and conclusions. But I’m not a climate scientist. As you know I have been looking for the basic science on which the calculations and models were constructed, since Tyndall. I notice that mistermack received a red tick from somebody when he stated " A skeptic doesn't declare the model right or wrong. They question the evidence, the method and the conclusions. That questioning is what's missing in CS. There might be some very good work done, but the bad stuff, the over the top conclusions are not questioned.“ I support him in that statement. Apropos of questioning the basics of the data on which climate science and calculations are based, I found a 2019 paper by Scafetta who did just that. You can read his interpretation of the literature yourself and draw your own conclusions. I think that what he says, sounds right, but the paper is of such a nature that it would be hard to summarize. If he’s right, then many of the current climate models need modification and if he’s wrong, then climate science is still too inconsistent. Scafetta (2019; https://www.researchgate.net/profile/Nicola-Scafetta/publication/334746460_ON_THE_RELIABILITY_OF_COMPUTER-BASED_CLIMATE_MODELS/links/5d496ede4585153e5940b019/ON-THE-RELIABILITY-OF-COMPUTER-BASED-CLIMATE-MODELS.pdf) in On the reliability of computer-based climate models. It’s in the peer-reviewed Italian Journal of Engineering Geology and Environment. The Introduction states “In this short review, I will briefly summarize some of the main reasons why the AGWT should be questioned. A reader should consider that a recent survey among more than 4000 members of the American Meteorological Society (Maibach et alii, 2016) revealed that 96% of the respondents acknowledges that a climatic change is taking place. However, with regards to its physical causes, only 29% of respondents agreed with the claim that 80-100% of the global surface warming observed since 1960 has been induced by human activity. Another 38% claimed that humans were responsible for 60-80% of the observed warming, while 26% claimed that natural climatic factors have contributed from 40% to 100% of it. 6% could not answer and only 1% thinks that a climatic change did not really occur. So, only a minority, probably far less than a third of the US meteorologists agrees with the claim of the IPCC that the totality (100%) of the warming observed since 1870 or 1960 has been anthropogenic. Thus, it is not true that there is a nearly total consensus on the IPCC’s main claims. I will try to explain why so many people with some expertise on this topic are skeptical of the AGWT of the GCMs.” So it’s not just people with a passing interest who question climate science, but a fair percentage of 4000 members of a Meteorological Society. This is part of Scafetta’s conclusions, but as I said, you’d have to read the paper yourself. “I have finally proposed a semi-empirical climate model calibrated in such a way to reconstruct the natural climatic variability since medieval times because it includes the millennial oscillation observed throughout the Holocene (Scafetta 2013a; 2013b). I have shown that this model projects very moderate warming until 2040 and a maximum additional warming of about 1.5°C from 2000 to 2100 using the same anthropogenic emission scenarios adopted by the CMIP5 models: see Figures 18-19. This result suggests that climatic adaptation policies, which are less expensive than the mitigation ones, could be sufficient to address most of the consequences of climatic changes that could occur during the 21st century. A major scientific implication of this research is that the climate is significantly modulated by astronomical oscillations which may generate solar-associated forcings different from the total solar irradiance forcing. This eventuality would further suggest that the current models are not reliable because important space weather climate forcings are still poorly understood and not included in the GCMs.” It's an article that mirrors my concerns as well as those of a high percentage of meteorologists. If any members reject the findings of this article, please present case arguments to substantiate your case. Nicola Scafetta is the author or co-author of about 70 publications up to 2016.Thanks again SwansonT, for the reference -- Gregory et al (2002; https://journals.ametsoc.org/view/journals/clim/15/22/1520-0442_2002_015_3117_aobeot_2.0.co_2.xml) in An Observationally Based Estimate of the Climate Sensitivity These authors acknowledged the same the same range of climate sensitivities as you did (1.5 to 4.5), although I have seen other references to climate sensitivities as high as 9. In their Introduction to that paper, the authors also identified this field of inquiry as a problem -- “Despite considerable improvements in many aspects of the simulation of twentieth-century climate by GCMs, the range has remained essentially unchanged during the last two decades, and is the greatest source of uncertainty in climate change projections for the twenty-first century.” Their conclusion was “the 5%–95% confidence interval for ΔT2× from this method would be 1.7–2.3 K. A range as narrow as that would be a great improvement on the current state of knowledge.” I would find that acceptable; it is somewhere near my extrapolation of the Mauna Loa real life data. The graph is certainly skewed but is uni-modal. The authors also claim that radiative forcing is the greatest cause of uncertainly, but my crude calculations from TheVat’s paper suggest that radiative forcing is not as important as the effect of peripheral GHG activity on Stevenson Screen temperature recordings. I note that this paper by Gregory et al was listed in the original graph I uploaded as claiming a value of 6 for Climate Sensitivity. After reading the paper I now state that in my opinion, the figure of 6 was erroneous and misleading. The value Gregory et al claimed was 1.7 to 2.3. I would think now that ALL of those figures, in the graph I presented, need checking. But I cannot find the original reference whence it came, and the clarity of the names in the graph is not good. But thanks you for your effort and comment. .................................... I can't see where the Stefan-Boltzmann Law comes into the issue? I would have thought that the only source of energy that can change is the Sun. Certainly there are sunpot cycles, but they are generally regarded as having nowhere near the effects on our near-surface temperatures as the atmospheric changes. I’m curious again.Studiot, I did observe your graphs, but I thought they offered nothing new from the dozens of such reports I’ve seen over the last 20 years. ......................................................... You can all stop jumping up and down in indignation, because a couple of posts ago, exchemist furnished a photograph of an infrared analyser. It was new to me. I was quite ignorant of its existence. So you’ve established my ignorance with that post and you can all be proud of yourselves for your acumen. It was the type of thing I have been looking for in the literature -- the IR emitter, the tube with glass at each end at least and a spectrometer. As you know, I kept going back in the literature looking for such a basic research tool. None of the papers published before 1960 mentioned basic data acquired from such equipment. The existence of that piece of equipment has satisfied my curiosity to a large extent. But just looking at the photograph, I think that the tube of the one I had in mind would have been more elaborate. It would have contained a number of ports for the insertion and removal of gases, mixtures at various combinations of gases and measuring instruments. I thank you for that, exchemist. I have given you another thumbs-up for it. I’d like to read more about the exact nature of the research studies performed with that IR Analyser. Would I be pushing my luck to ask if you know of a good starting reference? How’s your sense of humour holding up? ............................................................ SwansonT asked the question of where I obtained the figures for my crude maths. It was a comment generated by the paper on radiative forcing that TheVat provided. Virtually all of the energy we receive on our planet is generated by the sun ultimately and I think it is now general knowledge that the Solar Constant at the edge of the stratosphere is in the order of 1360 Wm-2. The edge of the stratosphere covers a far greater area than the area of the Earth itself, and it is now generally accepted that about a quarter of this targets the Earth -- 340 + Wm-2. But this is only in the daytime, so that the average amount reaching the Earth during daylight hours is theoretically in the order of 170+ Wm-2. But because of the atmosphere and aerosols causing reflection and albedo, the amount actually reaching our surface (where we measure our temperatures in Stevenson Screens) is of the order of 156 Wm-2. Now it is already generally accepted that our overall average temperature without an atmosphere would be -18 degrees C, but that due to the atmosphere, we have an overall annual average of 15 degrees C. This means that the atmosphere, acting as a whole unit, accounts for a reduction of 33 degrees C in our average overall temperatures as a whole. If 156 Wm-2 is reaching the surface and near-surface temps are measured 4 feet of the ground, then each 1 degree C in the shade equates to 156/33 Wm-2, which equates to 4.7 Wm-2 per 1 degree C at the surface. I know that 55 Wm-2 is reflected from our surface as long wave IR and that part of this is reflected back in turn as radiative forcing. The figure given for the CO2 share is 1.7 odd Wm-2 and the paper cited by TheVat for double the CO2 states that it would rise to something like 3.5 Wm-2. The increase would actually be in the order of 1.7 Wm-2. So 1.7/4.7 (0.34) would equate to the temperature increase due to an increased radiative forcing from doubling the CO2. And that would be so only if the effect was linear. As I said, it can’t be right. I have to be overlooking something. I’m always learning, so I would appreciate if anyone can see what must be a glaring fault. I must be different from most people, because when I discover something new, I always realize how little I really know. And I don't mind being corrected. ............................................................... My beef is with the acceptance of even a 3-fold variation in climate sensitivity figures (3-fold is SwansonT's figure). All of you seem to be satisfied with that degree of inconsistency. Of course, the effects of doubling the CO2 to 600 ppm on the temperature-measuring devices in the Stevenson screens would be an increase due to the increased peripheral surface level activity of the GHGs. This seems to be the area of contention because we don’t yet have any real time correlations available for 600 ppm CO2 and temperature. I used the real life figures from Mauna Loa for correlations between CO2 up to 400 ppm and temperatures, to subjectively extrapolate a figure of just under 2 degrees C increase in temperature for increases of CO2 from 300 to 600 ppm. And that seems to be where the available figures are clustering in the graph I uploaded some posts back. How do some researchers come up with figures of 6 degrees C or more if the basic science is flawless? ................................................................
Important Information
We have placed cookies on your device to help make this website better. You can adjust your cookie settings, otherwise we'll assume you're okay to continue.