
WaxyChicken
Members
-
Joined
-
Last visited
Everything posted by WaxyChicken
-
While the analysts will use math to determine percent of change, margin, profit, etc... they do not use math to determine future movement and leave that up to Rorschach approach and it is used for how they place their buys and sells for the billions of dollars on the stock market. Billions of dollars that is not theirs but instead their client's money. Investment groups. Pensions. Mom and Pop's 401K's. And this approach is taught as standard at every major university as if it were scientifically sound. It is the approach that is used for market predictions from MSNBC to Bloomberg. an example is : https://blog.cex.io/trading-tips/successful-trading-with-cex-io-introduction-to-simple-chart-patterns-12242 so based on what the market did the last few days you can predict if your dad will die of COPD complicated pneumonia resulting in your widowed mother selling the stocks they hold pushing the market down. Why did this happen? Because a few days ago the market made this or that dip or curve... if you look at it just right. it's a "Tarot-Card-Conspiracy-Theorist" style of thinking that i wish universities would not endorse.
-
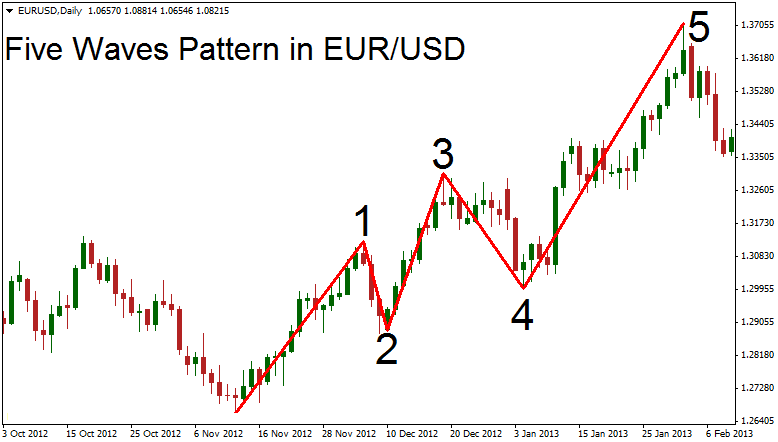
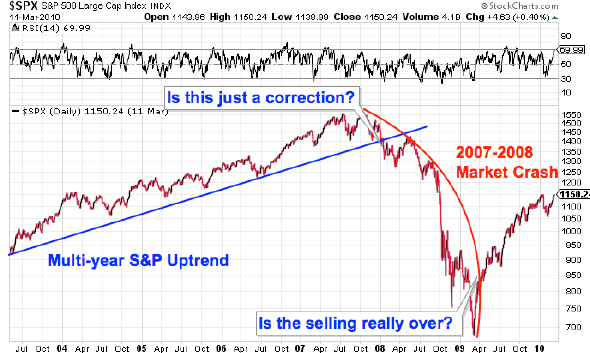
the above link without the pay-wall: https://www.google.com/url?sa=t&rct=j&q=&esrc=s&source=web&cd=1&cad=rja&uact=8&ved=0ahUKEwjJ1Z_JztjaAhXEm-AKHVuwCGsQFggoMAA&url=https%3A%2F%2Fwww.ft.com%2Fcontent%2Fabd15744-9793-11e2-b7ef-00144feabdc0&usg=AOvVaw0Ga6AnciIZXA4gDwG6Fl7F Don't forget though, it's not math. it's more like pattern recognition. very abstract pattern recognition. for example, an "M-Wave" shape only appears to be an M if you ignore all the jittery bump and dips. But at some point someone will say "That's too bumpy to be an M-Wave" while others will still think it's an M-Wave. it is so open to interpretation that this is why i used the reference to Rorschach above. in the sample posted below, is that an Elloitt wave? or does it not follow closely enough? because there is no real math behind the "What does this look like to you?" question, one can go extreme and say the above image looks very much like the below image: The answer to me is simple:

-
I'm incredibly dismayed that this tea-leaf reading practice is taught at major universities that are otherwise quite credible. it's even taught at Cambridge university: https://www.mrao.cam.ac.uk/~mph/Technical_Analysis.pdf This is giving credit to fortune telling, not science. Yes, i agree with you, Prometheus, such definable time-period influences are valid (ergo: the christmas shopping season and toys, winter and salt sales for the roads) however the teaching is that price and volume strictly from the chart tells you all that you need to know. i find it highly suspect that 702,454 people sold their stocks in July just because 909,134 people bought stocks in January. yet this is taught at every major university and business school. disconcerting.
-
First time posting so apologies if this question is in the wrong section. I've recently gotten into the cryptocurrency market and so I've spent a lot of time online studying market analysis. When i got started i though it was the study of how stable a business or commodity is, outlook on productions, etc... instead I find that "Market Analysis" is the study of previous market movements to determine future market movements. some examples can be found here: https://optionalpha.com/13-stock-chart-patterns-that-you-cant-afford-to-forget-10585.html I've studied this hard and deep and then came to a sudden realization - This seems an awful lot like horoscopes. Let me give you an example: A rumor starts that Quick-E-Mart's CEO will be stepping down. QEM's stock drops 5% due to uncertainty of who the next CEO is. Then it's revealed the rumor is false and in fact the CEO is just going to japan to close a deal on a big expansion. QEM's stock responds by jumping 10%. With Market Analysis the theory appears to be that the 5% drop and 10% jump could of been predicted because two weeks ago the market chart made a funny M shape, or bounced off an Elliott wave, matched a trend line, or proved a Fibonacci sequence, etc... and "Oh, we over-looked see this line dip in the chart over there so that's why it jumped 10% when we weren't expecting it to." This sounds totally preposterous to me once i began to think about it and i have to ask: has anyone ever actually scientifically tested this whole Market Analysis / Chart Analysis field? These Market Analysts make from $33k to $121k a year getting paid to place other people's money on the market. It appears to be a recognized field of study with degrees at major universities. but does it hold scientific H2O? Thank you for any information on actual research done to test scientific validity of this field. PS: i suppose it COULD work if everyone charted the same way. EG: if all market analysts expected the price to drop 5% then they'd take steps which would create a self-fulfilling prophecy. But it's subjective enough that you will easily find recognized professionals saying different things at the same time on the news channels about what to expect from the DOW or NASDAQ because they all appear to interpret the Rorschach / Chart pattern differently.