


Samm
-
Posts
45 -
Joined
-
Last visited
Content Type
Profiles
Forums
Events
Posts posted by Samm
-
-
Well I already said that I can agree that time stopping isn't logical and haven't mentioned it since.
Looks like we're making progress.
You should really read my posts more carefully because I said that exact same thing.To be fair, you looked as if you were attempting to discredit General Relativity, by stating:
Once again, general relativity isn't the only thing that describes the universe, and in fact it cannot completely describe the universe because it implies determinism. Yeah, I understand all these "reference points" and how all that works, but some things are just not so relative.As if that somehow meant something, other than General Relativity isn't 100% perfect.
Otherwise, is there actually some other experiment where we would relatively measure something to be at absolute 0 just because of the angle or location we're at?If temperature is the average kinetic energy of particles randomly bouncing off each other, in different directions, then no.
Well we can't really prove anything with black holes, but entropy is carried by photons right? Well photons aren't suppose to be able to escape a black hole, but I don't know for sure because Stephan Hawking, a very smart person, said black holes can evaporate.Photons are the messenger particles for the electromagnetic force. Entropy and photons have little to do with one another. Entropy is just a measure of how much non "useful" energy there is in a system ie. how much energy can't be used to produce work. Or alternative the number of ways one can rearrange the atoms of an object and have the object still look the same, although I'm not too sure on that one.
Ok, energy, but atoms can't decay past the ground state even though the laws of thermal dynamics say that all matter has to eventually decay to heat or I guess photons right?Wait... Are you confusing this with the idea of the heat death of the universe? A state where close to maximum entropy is reached, pretty much at the end of the universe. Supposedly all the matter evaporates into photons or decays into leptons
Although, is every atom in a substance existing in a ground state technically absolute 0?No. There is a such a thing as zero point energy, which is the energy that a something has in its ground state.
0 -
What is Cherenkov radiation?
I think it's where the electrons or other charged particles travel faster through a medium than the speed of light in that medium. And then this produces radiation through some mechanism that I don't understand.
Edit: On further research it has to be a dielectric medium. But I don't really know what that means either.
0 -
Well your probably not a scientist because real scientists know that laws aren't meant to be these "grand, un-shakable pillars of eternity". They simply state what "should" logically happen given our current knowledge. But, we don't know everything, so there's room for these things to be wrong and change, just as the very model of an atom has changed.
Besides, I thought kinetic energy and quantum mechanics was physics, but I guess if you have some way to disprove all of that, I'd like to see it.
Kinetic energy and quantum mechanics IS physics. What you're saying doesn't make any sense. It's not physics. I mean from what I can see, you're trying to establish that objects stop in time because measurements are events that don't occur continuously. As you're very keen to point out, measurements are distinct from the object. The measurement is just an image that we can see of what's going on, so... what does that have to do with any objects actually stopping in space, let alone time?
And if a law of thermodynamics was disproved, it would be the largest science news was disproved, it would likely make headline news and be everywhere. I don't think we have yet seen that.
Once again, general relativity isn't the only thing that describes the universe, and in fact it cannot completely describe the universe because it implies determinism. Yeah, I understand all these "reference points" and how all that works, but some things are just not so relative. The laws of physics are not relative, at least not with our current knowledge, and part of the laws of physics is that atoms exist as entities of undefined locations, as well as kinetic energy having the inherent property to make things move, although "how" much something moves can be perceived differently.General Relativity doesn't say "EVERYTHING IS RELATIVE". It doesn't. The laws of physics apply to all reference frames, to the same degree. It's just the way it works.
What I'm saying with regards to liquid helium and broken thermal dynamical laws has been proven through experiments conducted around the world (except for black holes obviously). If you are somehow a scientists, your obviously one of those scientists who isn't really keeping up with the times, much like Einstein who didn't even acknowledge the existence of the Strong Force within nuclei and so faded away from the frontier of science.Liquid helium is a superfluid under the correct conditions. Superfluids have high thermal conductivity, not infinite thermal conductivity. They are very strange, but it's not like they actually break any rules. They are frictionless, yes, but that is well documented and it doesn't actually void the laws of physics.
C'mon, even quantum mechanics was invented like half a century ago, get with the times.It's funny that you say this because Dr Rocket seems to have the famous Nobel Prize-Winning Quantum Physicist Richard Feynman as his picture. Which would be odd for someone who doesn't know anything about Quantum Mechanics, now wouldn't it?
0 -
Yes and no. It doesn't matter a whole lot how much warming is natural and how much is from anthropogenic causes because warming will occur naturally and we do need to be prepared for it. OTOH, that warming which is caused by anthropogenic causes is largely caused by pollution and warming or not, that is bad for the environment we depend on. It's time for man to quit pissing in his own bath water and clean up his act.
I wouldn't agree entirely on that. If it is man-made and we are in fact causing global warming or climate change, we can actually take action to reduce greenhouse gas emissions and reduce hence future warming.
0 -
- Although somewhat speculative, Carl Sagan's Pale Blue Dot was excellent.
- Wonders of the Universe, by Brian Cox is probably my favourite book out of all the books I've read.
0 -
Am I the only person who has a hard time believing that an object in motion tends to stay in motion? If this is true, doesn't that mean a car could never stop moving if it were to start moving?
That would be true if the car was on a frictionless road, driving in a perfect vacuum.
0 -
There's a formula for the force of gravity upon two objects:
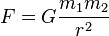 ,
,Where:
F = the force between the masses.
G = the gravitational constant
m1 = the first mass
m2 = the second mass
r = the distance between either mass.
It's called Newton's Law of Universal Gravitation.
If we're talking about an object falling towards earth, we can make the mass of earth m1 and the mass of the falling object m2. Now it just so happens that the acceleration of an object is equal to the force on it divided by its mass (a = F/m). So that means we can divide Newton's Universal Law of Gravitation by m2 (the mass of the falling object).
So we get:

And you'll notice that m2, the mass of the falling object has nothing to do with its acceleration. This equation will apply on pretty much any planet, moon, object etc. In fact astronauts on the moon have performed an experiment that supports this result:
Apologies for the missing equation. For some reason I can't edit the post, so here it is:
 0
0 -
About the transformer, I meant a power source which, while DC, could have its voltage changed. Sorry for the confusion.
And yes, the pentiometer seems to fit exactly with what I remember about the circuit design.
0 -
Lawrence Krauss once proposed something like that.
He basically shows that the universe has no total energy (gravitational potential energy is negative) because it's geometry is flat. Now the interesting part is that with no total energy, the universe could have come from a quantum fluctuation; virtual particles popping in and out of existence.
0 -
Now I remember distinctly that one of my science teachers described to me a circuit that one could use to measure the potential difference of a galvanic cell; it's E0 value, ie. it's electric potential where there is no current. It involved a transformer, a micro-ammeter, the galvanic cell and a rheostat. I want to know how it works and possibly get more info on the subject.
Cheers.
0 -
There's a formula for the force of gravity upon two objects:
,Where:
F = the force between the masses.
G = the gravitational constant
m1 = the first mass
m2 = the second mass
r = the distance between either mass.
It's called Newton's Law of Universal Gravitation.
If we're talking about an object falling towards earth, we can make the mass of earth m1 and the mass of the falling object m2. Now it just so happens that the acceleration of an object is equal to the force on it divided by its mass (a = F/m). So that means we can divide Newton's Universal Law of Gravitation by m2 (the mass of the falling object).
So we get:
And you'll notice that m2, the mass of the falling object has nothing to do with its acceleration. This equation will apply on pretty much any planet, moon, object etc. In fact astronauts on the moon have performed an experiment that supports this result:
0 -
I would have to disagree swansont, if you are referring to energy not being a physical thing. But if you are referring to joules, kilo-watt hrs, etc... then I would have to agree. This has always interested me from a distance. E=mc2, to think that mass traveling that fast would be pure energy. I've always wanted to ask those who believe in time travel if they thought the mass that energy is, is traveling backwards in time.
I've also wondered what energy is. Is it anything that gives off heat or exzerts force? Is it just molecular reaction and we just generallize it by calling it the same name no matter from what source it comes from? And what about the sources of energy that we don't fully understand, such as gravity or field energies period. To be defined as energy it would still have to hold mass at twice the speed of light, wouldn't it? Being a distant observer there are probably answers to these questions and I've just not gotten around to finding them.
First of all, I'd like to point out that there is no such thing as an "energy particle". There are messenger particles of different forces which can transmit energy (eg. the photon), but inside them we don't find "energons". Energy is an abstract concept; the ability to do work. These particles merely possess that ability.
You also seem to have a very strange understanding of Einstein's E=mc2 formula. It simply shows that matter and energy are equivalent that energy has mass and that matter has energy, and that you can change matter into energy and vice versa. If you're interested have a read of the wikipedia article here.
0 -
It appears as if 2010 was the warmest year on record, equal with 2005, according to NASA and NOAA. It's interesting to note that the latter half of the year was actually influenced by a strong La Nina event, which is usually associated with cooler conditions.
0 -
Sorry to use an "Argument from Incredulity", but really what would be the odds that the third period of warming in a non-linear chaotic system would be exactly the same as the previous ones from natural causes? Note that the "We can't think of anything else to account for the warming" is an "argument from ignorance".

First of all, it is not exactly the same. The most recent one lasted longer and warmed more than the previous periods of warming. And what are the odds of a non-linear chaotic system producing similar outputs if the most of the inputs remain much the same. I don't see it is as too improbable.
Can you prove the ENSO forcing isn't high enough? Nobody else has. TSI is the same, but has its content changed? What would be the effect on the climate of an increase in incoming short wave radiation? How does you theory account for the current lack of warming? Natural variations cancelling out the CO2 forcing? And these natural variations are amazingly growing in strength at exactly the right rate to counteract the influence of the CO2?Well, I can cite a paper that supports these statements. I can't prove it, I can provide evidence in it's favour. Here is a graph depicting the temperature rise due to the various different influences on climate. From Lean, J. L., and D. H. Rind (2008).

Additionally, the "current lack of warming" isn't really doing the data justice. It's a currently lack of statistically significant warming, at the 95% significance level. Here's what Phil Jones would like to say:
I also calculated the trend for the period 1995 to 2009. This trend (0.12C per decade) is positive, but not significant at the 95% significance level. The positive trend is quite close to the significance level. Achieving statistical significance in scientific terms is much more likely for longer periods, and much less likely for shorter periods.The difference here is in approach. If we assume that internal forcings and variabliity are large then CO2 becomes a minor player and the temp changes seen fit rather easily. The sun was at its most energetic for quite some time during most of the 20th C. Allow for a bit of lag. Apply a 60 year oscillation for the PDO etc. Simple answer. But if you want CO2 to be a major player you need a large number of highly unlikely events to transpire to fit the record.You need the natural forcings for the first two warmings to phase out at such a time and at such a rate as to allow CO2 to "take over". You need aerosols to increase and at such a time and at such a rate as to emulate the (possibly) volcanic cooling of 1880-1910. You then need those aerosols to decrease at such a time and at such a rate as to allow the warming from CO2 to equal the forcings from the earlier periods. And from 2000 to present you now need to find this magical place that the missing heat has gone to and is apparently "hiding". Either that or you need to find the negative forcing that is growing at such a rate as to almost exactly cancel the CO2 forcing. All these things are required if CO2 is a major player..
First of all, according to the graph above, the "current lack of warming", which isn't really a current lack of warming, can be explained by a decrease in the solar irradiance, and a decrease in ENSO forcing. The period of cooling seem between 1880-1910 according to the graph, appear to be due to volcanic aerosols and low levels of solar irradiance, coupled with a low level of anthropogenic forcing.
All this makes my position very difficult. Reason tells me that CO2 should be a minor player in the climate system, but I trust the physicists who say that we should have had some .6 degrees warming from CO2 increase. Which is why I sometimes seem to bat for both sides. I'm sceptical of the idea that CO2 is a major player but I'm also sceptical of any explanation that accounts for the warming without CO2. There is way too much either/or, it must be this or that, no middle road. For example it seems reasonable to me that for the period 1970-2000 with the PDO etc in positive mode they account for half the warming with CO2 the other half. Now they have essentially switched to negative mode, their negative forcing counteracts the CO2s positive forcing. I know it's not strictly accurate, but I hope you see my point. Both sides are simply too certain of their correctness.Okay, I understand what you're saying. Natural influences appear to influence the short-term greatly, but over the long-term CO2 seems to win out. Any explanation that says it's only CO2, or only natural causes, behind any climate phenomenon, is likely to be wrong. I concede that solar irradiance, appears to have helped along the greenhouse effect (see graph), and feedbacks play a significant role.
I don't know if it's true, but I've read on the net that the Scottish legal system has a third category besides "Guilty" and "Innocent", that category is "Not Proven". That best sums up my position. I don't find CO2 guilty or innocent, I find the case "Not Proven".I'd consider it to be probably guilty. Not 100% sure, but it's definitely better safe than sorry.
But it hasn't 1 degree in a century, has it? It's been about .7 degrees in a century and a half. One of the things that bugs the daylights out of me is that every time you see one of the ice core records, the last 10,000 years is a great big splodge on the end. We know the temps go up and down, because it's a tall splodge, but a detailed look would be nice. Is the current rate unusual? If we plot the Greenland data from Alley R.B. 2004 from the NCDC, we get this for the last 10,000 years.
Do you see anything particularly unusual about the current period? I don't. So let's look a bit further back, 50,000 years.

Yes, sharp rises in temperature sure seem unusual, don't they?
 Granted, there will be high latitude amplification, but the temps sure changed a lot. I'd say that a degree per century isn't that unusual at all.
We'd have to figure out the actual rates of temperature rise for those spikes. Additionally, that is only one proxy, it doesn't invalidate reconstructions that either take it's data into account, or use a number of other proxies.
It wasn't that long ago that 2.4 was the minority and 4 degrees was the majority. It's about science, not a popularity contest. I'm much happier letting the science develop without suggesting what they should find.Yes, true, however, my point is that you shouldn't base your conclusions on just one new paper, especially when it contradicts a whole number of others.
Definitely. I was referring to the natural forcings and feedbacks in the climate system. Sorry for not being clear on that. I would think that human influence and the Sun would be the only external forcings that aren't effected by something else.Indeed.
If by that you mean that this single new data point (or the data points gathered in the last 12 months) moves the correlation coefficient a little bit closer to 1, slightly strengthening the correlation between the manmade CO2 emissions and temperature increase, and slightly reducing uncertainty... then you might have a point.If, however, you mean that the fact that this was the warmest year on record means that this single data point proves the global warming all by itself, then you're completely wrong.
The former rather than the latter.
0 -
I'll have to search deeper, but here is one post covering the period 1880 up to today WRT the ENSO and PDO.
While the period since 1860 has seen a general warming trend it is important to realise that there are in fact three warming periods within. 1860 - 1880 warmed, 1880 - 1910 cooled, 1910 - 1940 warmed again, 1940 - 1970 cooled slightly, 1970 - 2000 warmed again and 2000- 2010 has done bugger all.
There has never been any suggestion that the first two warming periods had anything to do with human emissions of CO2, they are accepted as being totally natural in causation. This may or may not be true BTW, however if we assumed a CO2 component in them we would have to show vastly increased warming in the third period and this is not apparent. (Because CO2 forcing would have to be much larger than we think.)
The rates of warming are as follows;
Period Length Trend (Degrees C per decade) Significance
1860-1880 21 0.163 Yes
1910-1940 31 0.15 Yes
1975-1998 24 0.166 Yes
1975-2009 35 0.161 Yes
As is readily seen there is no statistical difference between the two "natural" warming periods and the supposedly "unnatural" most recent one. In a BBC inteviewPhil Jones had this to say;
I give you two hypotheses;
1. That the first two warmings were natural and the third was caused by CO2. This happened in such a way as to amazingly fit the observed warming/cooling cycle (for period) and also in a freak of improbability produced a trend not in any way different from the previous two "natural" warmings. That the natural forcings stopped in the period 1940 - 1970 and CO2 took over producing exactly the same forcing over the same period as the natural forcings. OR
2. That a natural warming/cooling cycle is occurring and the CO2 signature (forcing) is so small that it makes no statistical difference to the trends. IOW, there is no sign of CO2 forcing.
However. Neither hypothesis explain the cause of the natural warming. Number 2 also leaves us with a problem. We know from radiative physics that an increase in CO2 must cause warming. (About 1.1 degrees for a doubling) This is why climate is a "wicked" problem.
I must admit that one thing the graph does suggest to me is that while CO2 may not contribute much to the warming part of the cycle, it does have an effect on the cooling part. The cooling from 1880 -1910 was much greater than the cooling from 1940 - 1970 and since 2000 it's been about level. This is sort of consistent with the idea that while CO2 doesn't lead to warmer days, it does lead to warmer nights.
The graph, it's a strawman. That doesn't show the actual level of CO2 in the atmosphere, it shows the level of CO2 Emissions. Additionally, there is actually a delay between the time the CO2 is emitted and the entirety of its effects are felt.
There appears to be nothing wrong with hypothesis 1. The fact is that although the warming periods are similar, the causes of them can differ. ENSO oscillations and other climatic variations still influence the current warming we are seeing. The fact is that the warming period in the past was probably caused by such effects, while today's warming is probably anthropogenic and influenced by such effects. That could in part explain why the the current warming is very similar to the warming in the recent past.
The reason latest period of warming is considered anthropogenic is because we know that we emit greenhouse gases, and there appears to be little else that can account for the recent warming. Solar Irradience has remained much the same, ENSO forcing isn't high enough and fluctuates far too rapidly and volcanic eruptions should be cooling the climate. Despite all this, we are seeing significant levels of warming. The similarity between the warming we are experiencing at the moment and the warming in the past doesn't invalidate this reasoning.
They were extreme circumstances and the climate response was equally extreme. But the current temperature cycle isn't extreme in any way so it doesn't require extreme natural forcings. Right from the beginning we have assumed (Note that in the Gradualist/Catastrophists debate the grads believe that natural climate forcings are small and that temp changes of more than about .20/century are caused by freak events whilke the catasts think that natural forcings are large and that temp changes of 1.00/century are not unusual.) that the climate response to natural forcings is small and that CO2 is a primary driver. One of the arguments against larger variations in history is that if they exist then sensitivity to CO2 is larger than assumed and the CO2 problem is therefore much worse. An alternate view is that while climate variability in the past was larger than the hockey stick shows, it was driven by natural forcings and not CO2, meaning that CO2 sensitivity may be lower than we think.Temperature changes of 1 degree/century do seem out of the ordinary. In fact coming out of the ice-age had a slower rate of warming than 1 degree/century. Then again, I don't suppose that actually accounts for decadal or centennial fluctuations. Additionally, nothing of that magnitude or rate appears in the temperature reconstructions over the past 2000 years. This in effect means that either temperature reconstructions are completely and utterly fail, or that 1 degree/century warming doesn't happen all that often, without anthropogenic interference. I believe that latter is more likely.
10 years ago, climate models centred around a 40 warming for a doubling of CO2 (counting feedbacks etc) they are now converging on about 2.40. A very recent paper from a NASA team (described here) puts the warming from a doubling from todays 390 ppm to 780 ppm at 1.650. Treating the climate as a purely physical object responding only to the laws of physics seems to be a bad approach. The climate is a biosphere which while it follows physical laws (in detail) is much harder to quantify in a model.Note that if this new figure is correct, it allows for much greater variation in paleo climate without an increase in CO2 sensitivity, meaning that natural effects must be greater than previously assumed.
Sure, if that new figure is correct, that means that increases in CO2 have less of an effect on the climate than originally expected. However, it should be noted that figure is in the minority and disagrees with many other papers. That figure although reassuring should probably be taken with a pinch of salt.
The thing that must be realised is that in reality there is no such thing as "Climate" as a distinct entity. There are only forcings and feedbacks. In the natural world I've yet to see anything that isn't a feedback of (or is uneffected by) something else. Clouds might be a temperature forcing, but they are also a feedback to temperature, GCRs and changing currents. GCRs are effected by the Suns magnetic field (and Thor only knows what all the things are that effect currents). Even natural increases/decreases in CO2 are feedbacks for temperatures and other factors. Climate could be described as an equation where every variable is a function of two or more other variables. Everything is a "forcing" of climate and everything is a "feedback" of climate.Though it is true that everything is fundamentally influenced by other things, it would probably be more correct to consider everything to be a feedback, instead of a forcing. However, the distinction should be made between feedbacks of the internal and feedbacks of the man-made and external. The fact is that all significant variations in feedbacks are internal or man-made. The fact is that the internal feedbacks are driven by for want of a better word, climate, while man-made feedbacks are not, and influence climate.
0 -
Here's what i figured. When you multiply any number (n) by itself zero times, Whatever that number is then becomes one unit (n/n), thus becoming one. Is this correct?
That's the reasoning I used. But then, I'm some silly high school student.
0 -
I like to think of it this way:
xn=x(n+1)/x
Although the above equation is pretty obvious, it helps to illustrate the idea. Let x be 4 and n be 0.
40=4(0+1)/4=1
You could think of it another way. When multiplying or dividing by indices, you add or subtract the indices. So:
41/41=1
Which could be rewritten as:
40=1
I hope it makes more sense now.
1 -
Samm, I think that many of the blogs are a waste of time, and the tone of many put me off. I like the articles at WUWT but generally skim the comments to see if anybody has posted a useful link rather than wasting my time reading the comments. WUWT would be much better if Willis Eschenbach or Bob Tisdale would actually submit for publication. They appear to know their stuff but I'd rather see the fight in the literature than in a blog. For example Bob Tisdale has shown rather convincingly that a very good fit to the instrumental temp curve is given by a constant .5 degree/century increase with a superimposed 60 year harmonic cycle (PDO and ENSO). The correlation is something like .87 IIRC, but I'd like to see it published rather than blogged. Lucias Blackboard is one that looks at things in detail. I tend to spend my time at Keith Kloors or lurking at Judith Currys.
Yeah, I'd like to see it in literature as well. It's more permanent, and adds a sense of reliability to the source. Speaking of which, that the constant 0.5 degree/100 years with a superimposed 60 year harmonic cycle, what does it show?
I don't look much at the "Warmista" blogs, either because of their tone or moderation policy. (Some of them come across as borderline "tin hat" brigade.) The important thing is to not judge the person by the blog. I've found all Climatologists respond to specific questions if asked politely. (In fact only one ever didn't respond to an email and I found out later that he was off sick for about 4 months with a severe illness so I'm not about to complain.)Right. I suppose that speaks about the general niceness of climate scientists then.
It doesn't make much difference in the current climate debate but it is interesting. If you read non modern climate change paleo you'll see that there were two sides. The Gradualists who have held sway pretty much since the beginning and the Catastrophists. Gradualists believe that the climate is huge and has great inertia, it can only change naturally at very slow speeds. Temperature rose, the ice gradually receeded, the sea levels gradually rose. (That's how it was phrased when I was in school.) They have the mental picture of the ice shield melting and feeding creeks and rivers with maybe the occasional flood event.Catastrophists have a different view. For them things can change very rapidly indeed. If the ice shield melts from the top then you would finish up with lakes of water on top of the ice held back by ice "dams". Think of light rain on a car bonnet. You get all those little pools of water and then one finally moves, it flows into another, and another and another picking up volume and speed as it goes. Now imagine the same thing happening on the top of 2 million square miles of ice shield with not only the area involved but also the drop of two miles of altitude to feed the speed. I remember reading one paper from the 80s (?) where the maths was done. Imagine a wall of ice cold water 500 feet high and nearly 100 miles wide and travelling at nearly 300 miles per hour with the force of over 1,000 cubic miles of water behind it smashing into the Atlantic. More than enough to disrupt the AMOC I would think. From start to finish less than 12 hours and within 4 days the NH goes from deglaciation to full blown ice age conditions.
Like I said earlier, scary as hell.
As you might realise, I tend to side with the catastrophists. I believe that the climate can change rapidly and globally from purely natural causes. The changes we have seen in the last 140 odd years is orders of magnitude less than has occurred in the past from purely natural forcings. Given this I'm naturally sceptical of people who claim that the current rate of change is "unprecedented".
Yeah, that sounds quite severe. I agree what you're saying in that abrupt climate change can occur, but that is usually caused by very extreme circumstances. Such circumstances don't seem to be occurring at the moment, the only thing extreme appears is the level of greenhouse gas increase. This probably lends some justification to the belief that we may undergo serious climate change in the future. Far more serious than we are experiencing at the moment. Given that greenhouse gases affect temperature, would you agree with the notion that steps should be taken to minimise greenhouse gas emissions?
"Galactic Cosmic Rays", the things CERN are looking into in the CLOUD experiments.Right. I thought so, but you never really know for sure until somebody explains them to you.
Currents are constantly changing on a global scale. A major event took place 55 million years ago when North and South America joined to block the Equatorial current into the Pacific. A mere 12,000 years ago Britain was part of Europe and most of the North Sea was grassland. Indonesia was one large land mass and America and Russia were joined by the Bering Strait land bridge so there was no water movement between the Pacific and Arctic oceans. These events changed the ocean currents and added millions of square miles of water from which evaporation could occur. Major events like these do indeed change the currents and effect cloud cover.On a smaller scale it's still going on. Due to the weight of the extra water since the last ice age the sea bottom is slowly sinking and since it lost the weight the land is still rising. Parts of Canada are rising at a rate of 2 cm per year. It's called "Post Glacial Isostatic Rebound". Scotland is rising and England is sinking. Silt from rivers is being deposited on Continental shelves making them slightly shallower and forcing the deeper currents upwards. In August 2006 the crew of the yacht Maiken witnessed the birth of an island in the Pacific.(The pics were floating around the net via email.) Another in the Pacific in 2000. The island Surtsey came from 130 metres down to be born between 1963 and 1967. The mid Atlantic Ridge runs from north to south with resulting islands from 710 north to 540 south and is in constant motion.
Individually the movements are small, but a new island must divert the currents around it and the effect is probably cumulative. Many people start from the basis that the planet is stable and pretty much unchanging. I start from the basis that the planet is dynamic and in constant motion and change. Temperatures wax and wane, storm intensities grow and diminish. The only constant in the climate system is that it will change, with or without the actions of man and we had better get used to the idea. Where this leads to a practical difference is that if you believe that climate to be relatively constant and slow changing, then you will believe it easy to find an anthropogenic signal in the data. However if you consider the climate to be relatively volatile then you will believe it far more difficult to find a signal in the data.
Yeah, I suppose I was probably wrong about currents only having a few inputs, I neglected to include the input of plate tectonics and sea levels. However, I don't believe that plate tectonics, being awfully slow moving would be able to affect the ocean currents enough to produce the significant warming we are experiencing at the moment. As for sea levels, I believe that they are a feedback of climate. I don't think there's very much that affects cloud cover that isn't a feedback of climate.
They don't have to do your work for you, you know. The reconstruction is calibrated to the same baseline average as the GISS and HADCRUT. In general proxy reconstructions are considered complete reconstructions even without the instrumental periods being used. Because the instrumental period is derived directly from the data it isn't deemed part of a "reconstruction". The term reconstruction is reserved for work where the temperature has to be inferred from proxies. It's a terminology thing, nothing more.Okay, I suppose I was wrong there.
Not quite. Remember that the theoretical basis of the reconstruction is that since the tree rings (or whatever) change in a regular fashion during the current period dependant upon temperature they will therefore respond the same way to previous temperatures. The proof of the methodology lies in the correlation between tree ring width and temperature over the instrumental period. Hence a lack of correlation reduces confidence in the methodology. Showing the divergence and offering an explanation as to why it is occurring and why your methodology is therefore still sound is good science. Truncating the data because it casts doubt on your methodology is nothing more than very bad science.The value of a proxy in a paleo reconstruction is a direct function of how well it correlates to the temperature record, that is how and why you choose proxies. You can't cut out the bit you don't like and tell people that the correlation is great, you have to show the full data and if there is a divergence, explain it. The explanation so far, which boils down to "There is an unknown factor, probably of anthropogenic origin" is bloody weak from my POV.
As an aside there was a link to a paper some time ago at ClimateAudit concerning this. Apparently many tree proxies are chosen because they are at the tree line, or vegetation border. The paper showed that some trees grow along the ground until the temps reached a certain point and then they started growing straight up. This led to a great change in tree ring width and density which might go a long way to explaining the divergence problem.
You should also be aware that the truncating is not being done to a proxy, it is being done to complete and published reconstructions. Specifically Briffa 2001 is truncated at 1960, with a couple of others in 1980. By truncating them you can say "See, the reconstructions roughly agree" without someone looking at the last 50 years and asking "Hang on, what's going on here?" I call that marketing, not science. This was "Mikes Nature trick" to "hide the decline".
Well, I doubt that the data was truncated solely because it casted doubt on their methodology. It is cut out, because the data is wrong from there on. If you are trying to do a reconstruction, that displays the temperatures as accurately as possible, truncating the data that is wrong, from when it starts to be wrong is understandable. I agree, it would be better to show the divergence and explain it, but there is no current explanation for it. In fact, it would probably better to just be honest about it and show the proxies to the present and mention that from 1980 onwards they disagree with the instrumental record for reasons unknown. However, it didn't but that doesn't entirely invalidate the data we are seeing.
0 -
No problems. You are debating well and reading the references. You're also polite which I think is a plus in any debate. (And it's something sadly lacking in the climate debate. Name calling and point scoring seems to be the usual order of the day. As the comments sections of Realclimate or Whats Up With That demonstrate.)
Thank you. I find it rather funny that the people in the comments sections often devolve into flaming on those climate blogs.
Quite possible. I came across the YD event while looking for examples of catastrophic change around the 9,000 BC mark. Meltwater intrusions into the North Atlantic fit the bill and might have been devastating when you work out how much water it takes and how fast it has to be added. Some of the papers on this are very scary. But intensely interesting as it deals with how an ice shield melts. We know the ice "receeded", but did it melt from the front, the top or the bottom? Or a combination? Differing theories lead to very different scenarios concerning the end of the Ice Age and what happened to the areas in front of the ice.Hmm. I probably should do a little more reading into that.
Agreed. But if you've been shot enough by enough people you would start to wonder yourself. A good example of what happens to those who don't toe the "consensus" line are some questions asked of Judith Curry recently by the person who edits her "Sourcewatch" page, I'll quote the email in full from here. http://judithcurry.c...t/#comment-6964So by starting a blog and engaging with sceptics some think it reasonable to assume that she is either mentally impaired or being threatened and/or blackmailed?
Yeah. That's pretty deplorable. I don't think anyone really deserves that sort of treatment for, almost anything. I mean, what's the writer of the email trying to do? Curry's not even a skeptic herself..
However, Spencer does seem a little weird. I can understand getting aggravated by his current predicament, but he seems a lot more accusational than that.
WRT clouds and the forcing/feedback question. Climatology views clouds only as a temperature feedback, working much the way you describe. In the short term clouds can drive temps, for example a cloudy night is warmer than a cloudless night. The nub of the disagreement in this area concerns whether clouds respond to other forcings as well. GCRs come to mind, also changes in ocean currents. Should clouds respond to these on a long term basis then they are still a feedback to those forcings but they become a forcing in terms of temperature.The question here is this "Do clouds only respond to temperature changes?" If the answer is yes, then they are a temperature feedback, but if the answer is no then they become a feedback for something else, but a temperature forcing. Messy as hell, but that is why Dr. Curry descibed climate as a "wicked problem" in her testimony to Congress.
GCRs? I'm not exactly sure what that stands for, sorry.
However, changes in ocean currents are they influenced by anything external greatly? I mean, it seems to me as if they're just a feedback of temperature, salinity and the Coriolis force. All of which are either internal, salinity and temperature or relatively stable, the Coriolis force.
I'll do some digging, it's been a while since I've looked at the paleo papers closely. I'll have to get back to you on this.Okay, that'd be great.
Look at the graph of Holocene temps you posted. while the resolution isn't great the period around 1500 AD is easily the lowest temps for more than 10,000 years. A point that you might want to consider too. If the resolution of the graph is too low to show the modern "extreme" warming, then it is too low to show any other examples of "extreme" warming as well.That is true. the resolution would prohibit us from seeing the more extreme and short term changes in temperature. I don't dispute that Little Ice Age shows up on that graph, although, it doesn't really appear on the peer-reviewed global reconstructions. So, I'm saying that I'm unsure of it's magnitude.
Remember that the "Global" reconstructions are based on interpolating specific sites or small regions, if there was a way to quantify the advance and retreat on the basis of temperature, the Alps could be used as a proxy for paleo reconstructions.Sure, that would be a good thing. Especially if it could be calibrated against the instrumental temperature record.
Anyway you might be interested in the results of Ljungqvist, F.C. 2010. The data is available on the NOAA siteand the graph looks like this; (Although this is extra tropical NH, not global.)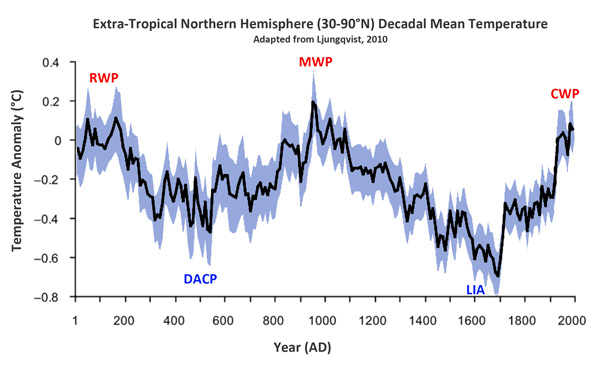
Again much closer to Moberg 2005 than any others.
Although this graph is probably fairly accurate, it is only a proxy reconstruction and lacks the instrumental temperatures in the last 150 years. The actual paper says the following:
The temperature of the last two decades, however, is possibly higher than during any previous time in the past two millennia, although this is only seen in the instrumental temperature data and not in the multi-proxy reconstruction itself.Basically, they haven't provided the instrumental record for comparison and to construe this as a complete temperature reconstruction would be a little dishonest. It should be considered a proxy-reconstruction only.
As much as I admire and respect swansont, a couple of blog articles do not refute a peer reviewed paper. McShane and Wyner has been published in the Annals of Applied Statistics as a discussion paper with invited discussion from both the climate and statistical communities, as well as a reply from McShane and Wyner. http://www.imstat.or...next_issue.html The papers are at the bottom of the page. I'm still working my way through them and freely admit that the technical bits are way above my pay grade, but it would appear that the statistical community is not as sure of the statistical methodologies used by climatologists as the climatologists are.I believe that Swansont addressed this.
That the data diverges from the temperature record is called the Divergence Problem. Dropping the data because it might weaken your case is called being dishonest, alternatively only showing data that strengthens your case is called "Cherry Picking". The data is not "wrong", the data simply is. Truncating the data rather than explaining the divergence can only be called "very poor science".Well... I can't see the issue with truncating data that disagrees with more accurate data. The proxies are probably less accurate than the instrumental record, and in order to make it a valid reconstruction you've actually got to reconstruct the temperatures to the best of your ability. Including data that is known to be wrong after a certain point on the graph can be misleading especially if the graph is meant to be a complete(ish) record of temperatures. I wouldn't consider it Cherry Picking.
I sincerely doubt that any practicing researcher on this forum would dump part of his/her data from an experiment. they would dump the lot and start again or find a good and sensible reason. Saying it's the "Divergence Problem" is as factually meaningless as saying "Pink fairies did it".Although the Divergence Problem is unexplained, it is known to exist among scientists. I'm pretty sure that they understand that tree-ring data starts to diverge from the instrumental record from around the 1950s onwards. It would be dishonest to include data that is known to be inaccurate from that point onwards. It would be akin to attempting to carbon date dinosaur fossils and then talk about their age based on the carbon dating. Carbon dating works, only within a certain range of circumstances, and dinosaur fossils aren't included in that set of circumstances. I imagine it would be a similar case here.
0 -
I think the pop is because Hydrogen burns fairly quickly and will happen of you have an accumulation of it when the flame is introduced With an alkali, once the combustion starts it will go continually; they get more reactive as you move down the periodic table. If one produced bubble without inducing combustion it would have to be Lithium. I can personally attest to the violence of Rubidium reactions.
I can say, I didn't know the hydrogen reacted continually, during some of the more energetic alkali-water reactions. Yeah, the hydrogen definitely combusts quickly during the pop test, I would almost describe it as a small explosion.
0 -
This happens with alkali metals as well. And since the reaction is exothermic, the liberated hydrogen is ignited and burns to create more water.
I'm pretty sure that's what makes the "pop" test work. You light a flame near the supposed hydrogen source and see if you can hear a "pop". It only works with relatively large quantities of hydrogen. It's a simple experiment and was actually performed by one of my science teachers.
It also should be noted that a number of the alkali metals react in a very nasty way to water. Some of the more inert ones produce bubbles. Which are probably hydrogen and if there's enough bubbles, it might be worthwhile doing the pop test.
On a slightly different note, I remember the same science teacher erecting blast shields before placing a small amount of sodium in a beacker of water. The sodium fizzed and hissed, dancing across the surface of the water (sodium actually seems to float). Probably producing hydrogen and sodium oxide. I didn't see a flame (supposedly indicative of burning hydrogen), but neither did I see a hydrogen flame when the pop test was performed.
0 -
Samm, good post.
Thanks actually. I'm glad I'm actually getting recognition from some of the more senior members of this forum, even if they disagree with me.
The cause and extent (of the cold) of the YD period is still being debated. One would have to argue that it was global because the idea that one hemisphere could drop to ice age conditions for over 1,000 years without any effect on the other hemisphere is insane. It would require that there be no mixing across the equator, simply not possible. The effects are also being discussed. Here we find that New Zealand was warmer and here we find that Vanuatu was cooler. We can safely say that the NH cooled, but what the SH did is still open to interpretation.Well, if it is true that the YD period is caused by a decrease of heat moving towards the Northern Hemisphere, and the radiative, greenhouse and other forcings stay roughly the same, one would expect a higher concentration of heat in the Southern Hemisphere.
As to the cause, you might find this PPT interesting as it covers a few of the possibilities. It was possibly caused by meltwater release, but whatever the cause it put paid to the megafauna around the planet and wiped out the Clovis people in north america.However, that is neither here nor there. I mentioned the YD to demonstrate that global changes far greater than those of the 20th C have occurred in the past from natural causes. I take it the point is made?
Yes, that point is made. The hypothetical causes were actually quite interesting. Thanks for posting it up there.
Sorry about that. Firstly I would have to say that it is more than possible, it is certain. To say otherwise is to say that cloud cover stays within 1 percentage point on centennial scales, the climate is simply not that stable. As to who I've been reading, Dr. Roy Spencer, the guy who does the UAH satellite temperature series. I get the feeling that he might have some idea of what he is talking about. Clouds are the biggest unknown in the climate system and GCMs treat them as feedbacks only. This is still being debated however, Spencer and Braswell 2010show that clouds can be a forcing but at the same time look like a feedback. CERN are also doing the CLOUD experiments to check on the idea of cloud formation being effected by GCRs. This research is ongoing.The bottom line is that many in the climate community view clouds only as a feedback response to temperature. However if clouds respond to another driver that is not temperature related they then become a forcing for temperature. Note also that the prevailing assumption is that the climate is a closed system that can only be effected by external forcings and temperature changes cannot be derived from purely internal variations. When dealing with a chaotic system opinions and assumptions become important. Lacis 2010showed by using a model that CO2 was the primary driver of the climate system, more important than water even. However to do this they assumed that WV and everything else is a feedback only and that was what was put into the model. Hmmm, you tell the model that only CO2 is a forcing and that everything else is a feedback and then I'm supposed to wonder why your model run shows that only CO2 is a forcing?
Okay. Roy Spencer... He's said this, it seems a little like a conspiracy theory:
Dessler's paper is being announced on probably THE best day for it to support the IPCC's COP-16 meeting here in Cancun, and whatever agreement is announced tomorrow in the way of international climate policy.I suspect – but have no proof of it – that Dessler was under pressure to get this paper published to blunt the negative impact our work has had on the IPCC's efforts.But if this is the best they can do, the scientists aligning themselves with the IPCC really are running out of ideas to help shore up their climate models, and their claims that our climate system is very sensitive to greenhouse gas emissions.The weak reasoning the paper employs – and the evidence we published which it purposely ignores! – combined with the great deal of media attention it will garner at a time when the IPCC needs to regain scientific respectability (especially after Climategate), makes this new Science paper just one more reason why the public is increasingly distrustful of the scientific community when it comes to research having enormous policy implications.I'm just saying that although Spencer may make decent papers, he does seem significantly biased and that much of what he says should be taken with a pinch of salt.
The amount of water vapour in the troposphere is considered a feedback for good reason. Naturally it maintains a state of equilibrium based on the temperature. This is because of its very short life in the atmosphere, around 10 days. So, over long periods of time, all other things being equal, the level of water vapour will stay much the same, save for short-term fluctuations. If you have an increase in temperature, you'll have an increase in water vapour in order to maintain the same relative level of humidity. This is a feedback, warming the atmosphere even more. Thus it's a feedback. Sure, this may a fairly superficial explanation, but I believe it's fairly close to the truth.
As for clouds, I'm not exactly sure. There seems to be very little if any, external forcing influencing clouds. Cosmic Rays is one, but that has yet to be proven. We know that clouds are influenced by atmospheric conditions, so it seems logical that clouds could be considered a function of the atmospheric conditions. As they may have an affect on temperature, it seems fair that they're considered a feedback.
Basically, although clouds and water vapour are important, they aren't the primary drivers of the climate. They play to the whims of the other greenhouse gases, because of their short life in the atmosphere.
You weren't wrong, the person who did the graph was wrong, you were mislead. There is a difference.
Yeah. I now realise it's important to look deeper into the issues so that you can make an educated decision.
For some reason the link to the paper has stopped working. There are many problems with paleothermometry, not least that the error bars are huge after 1,000 years. Personally I'd like to see somebody do it with everything we've got. I'd also like to see somebody do a global reconstruction of the 20th C using say, 13 stations from around the planet. And have it accurate to .1 of a degree or less.I can tell you the former would make an excellent paper. Remember you'd have to discount the proxies that don't work, and fail to correlate with the instrumental record. The latter, that would be interesting, but I doubt it'd be published as a paper, I'd like to see it as an intellectual exercise. Furthermore, I think that the Mann and Jones 2003 paper did include significant error bars. It doesn't appear as if they purport to have some ridiculous level of accuracy.
I think I've found another link to the same paper, though it is in the same domain. Try this.
Samm, note that I didn't say that all reconstructions get calibrated against global temps, some are and some aren't. You did note the bit about "weighting", depending on the weightings, you can make a result say pretty much anything you wish. I'm not suggesting anything untoward by saying that, or any attempt to mislead, but "confirmation bias" is something to always be worried about. (Even for us sceptics. ) There is a good article here on the work of Dr. Ioannidis concerning this.That is a good point, would you mind telling me which ones were and weren't? I know that number 7, Mann and Jones 2004 is not. It definitely doesn't calibrate proxies with the global instrumental temperature record, it actually calibrates the proxies with the local temperature record. The paper says the following:
The use of instrumental climate data records is an essential component of high-resolution paleoclimatology, as it provides the quantitative information against which proxy climatic indicators must be calibrated. The longer the instrumental record in the vicinity of the proxy site, the greater the potential for accurate assessment of the fidelity of a proxy reconstruction achieved by local calibration approaches.As to the warming being "unprecedented at least in terms of the last two millennia", big woop. Have a good look at the long term temps and you'll see that the period circa 1775-1875 was arguably the coldest period in the last 8,000 years. The highest temps now don't make it to the lowest temps during the Holocene Optimum. Are you really surprised that temps have risen since we left the Little Ice Age?Would you mind sourcing that claim about the Little Ice Age? It doesn't really show up on any of the graphs I'm seeing. And yes, I would expect the temperatures to rise to a normal level at the end of an Ice Age (say no higher than the MWP), as opposed to an unusually high level as we are experiencing now.
On the subject of the Holocene Optimum, here is a rough statistical analysis of several proxies in different parts of the world (coloured lines) that provide information on temperatures reaching back to the end of the last ice age. The black line is an average of those temperatures. This provides a rough guide on the temperatures of the Holocene. Note that the temperatures have a resolution of about 300 years which as a result, doesn't actually show the current warming.

This should serve to illustrate that the current temperature increases are actually rather drastic, in that they are occurring too fast for the graph to show. Additionally, it also illustrates that the Holocene Optimum wasn't actually warmer than the temperatures we're currently experiencing, at least on a global scale. You could actually argue that the temperatures were cooler during the Holocene Optimum using this graph, however, the resolution is too low to make a fair comparison.
You might be interested in this paper from JGS concerning prehistoric finds that were under the Swiss glaciers. The finds were grouped "from four distinct windows of time: Neolithic Age (4900 to 4450 cal. yr BP), early Bronze Age (4100–3650 cal. yr BP), Roman Age (1st–3rd century AD), and Medieval times (8–9th century AD and 14–15th century AD)." The results of this paper go both ways; Firstly and obviously it means that the studied glacier has retreated further than at any time in the last 5,000 years or so. Conversely it also shows that there was a "Roman Warm Period" followed by a cold period where the glacier advanced and then a "Medieval Warm Period" where the glacier retreated again. This was followed by a glacial advance for the LIA and then the current warming. Such a timeline doesn't look much like the gradual drop in temps the reconstructions show, does it? Not being mean, but I'll take solid archaeological evidence over a statistical "reconstruction" any day.Although I'm the study is probably relatively sound, having only skimmed over it (I'm a little tired of reading through climate science research papers), I can't help object to the nature of the record. It only measures temperatures in the Swiss alps. The climate reconstructions are better measures of the global climate because that is actually what they measure.
Well, it's now 2am. So if I've stuffed up or missed something or not made sense, let me know and I'll adress it in another post. Cheers.That's pretty good for a 1 am post.
Mann seems to have employed a form of conformational bias to generate a graphic that supported his view of historical and current climate change. He carefully chose a proxy that was known to de-emphasize the medieval warming and 1500-1700 little ice age. Then he chose a subset of that proxy that he could apply statistical analysis and obtain a result that closely matched his previous erroneous and discredited prior results. However because his proxies failed to continue the desired upward trend he was looking for post 1980, he simply tricked the data by dropping the proxy in favor of a a data set that supported his viewpoint better.
Here is a rebuttal article pointing out Mann et al's statistical weaknesses and providing a basis as to why one should not put too much stock in Mann's reconstructions.
The article generated a firestorm of discussions, much of it is available on the web at various locations.
I believe that Swansont addressed most of those points. I would like you to name that proxy, and the study it was used in, so I can better address that claim. Additionally the reason he dropped the proxy data after 1980 was because it was wrong. The tree-ring data disagreed with the instrumental temperature record data. It's called the divergence problem. When you have data that is glaringly flawed, you probably should remove it. That is what they've done there.
0 -
I believe in the future stem cells will cure everything and stop the aging process, and I also think that any mammal travelling at high speed would be affected by failing organs and a weaker immune system (just my opinion).
So, two people of the same age are on Earth. They are identical twins, twin A and twin B, they are 20 years old. Twin A boards a spaceship and begins to travel near the speed of light, Twin B remains on earth. 40 years later Twin B, still on earth is now 60 years old but thanks to stem cells he looks and functions still like a 20 years old. Twin A has just returned to Earth and (unless he died in the first few hours) he looks much older than Twin A because he didn't take any stem cells.
Any thought on this?
Thanks.
So you're accepting that the time-dialation predicted by Einstein's relativity as fact? See, the twin paradox doesn't have anything to do with how old the twins look, it's do with how old they are. The twins could be interchanged with clocks anything else and the result would still be the same.
And why would a fast moving animal be affected by failing organs and a weaker immune system?
If you want to understand relativity, I would highly recommend this book: Relativity Visualised. I'm not a scientist or anything, but Epstein really manages to explain the theory almost entirely without maths. I'm a secondary school student and this guy makes sense.
0 -
Firstly the cause of the YD is unknown. We have theories that range from ocean currents through meteor impacts right down to mammoth farts. None of them properly explain the period. However I used it to illustrate that climate has changed far more rapidly in the past than in the 20th C. You asked if it could be shown that climate could change rapidly, I showed you.
I'm don't think that is entirely correct. I hadn't really realised this at first, but the Younger Dryas appears to be confined to the Northern Hemisphere. This article: What Caused the Younger Dryas Event, by Anders E. Carlson, published in Geology says the following:
The North Atlantic region cooled during this interval with a weakening of Northern Hemisphere monsoon strength. The reduction in northward heat transport warmed the Southern Hemisphere due to a process commonly referred to as the bipolar-seesawSo while the Younger Dryas may have been greater in magnitude than the current warming we are seeing now it was actually more limited in terms of extent.
Furthermore, there appears to be a prevailing theory among climate scientists. The same article goes on to say:
Although it is generally accepted that the cold event resulted from a slowing Atlantic meridional overturning circulation (AMOC), the forcing of this AMOC reduction remains intensely debated.You are correct that "that sort of drastic change is not occurring at the moment" because the temp change is much slower than then although todays change is not "drastic" by any means.I was referring to the cause of the Younger Dryas event when I stated that, sorry for the misunderstanding.
Note that change in cloud cover of around 1% over the last 150 years is quite capable of explaining all the warming since industrialisation. Are you assuming that planetary cloud cover doesn't change by a percentage point over centennial scales? Do you believe that cloud cover is really that stable? If you agree that clouds could change by that much over that period then you have an alternate hypothesis capable of explaining much of the warming.It may be possible for that change to occur, but that doesn't actually mean it did. Secondly, I would like to see a source for that claim, as you have neglected to provide one.
Secondly I suggest you actually read the papers from your spaghetti graph. You will find that a number of them are not global reconstructions at all, but northern hemisphere ones. In the case of MBH 1999, the entire 14th C comes from one pine tree in the US. Call me a scientific purist if you will, but I doubt that the hemispheric temperature for an entire century can be extrapolated with any accuracy from one tree. If you follow the link I gave you will see temp reconstructions from every continent. I suggest most strongly that if proxies from every continent on the planet show both a MWP and a LIA, then they were indeed global phenomena.I understand I was wrong when I stated they were all global reconstructions in hindsight. The fact that one of these graphs may have been dubious doesn't invalidate all the other graphs. M.E. Mann and P.D. Jones (2003). , Geophysical Research Letters, 30(15): 1820. doi:10.1029/2003GL017814 is a global reconstruction using 13 different data sets. It alone should be reasonable evidence to suggest that the current warming is unprecedented at least in terms of the last two millennia.
As stated yes. GHGs, specifically CO2 do not "trap" outgoing radiation. They block and reradiate it. This has the effect of slowing the outgoing radiation, not trapping it. The end result is roughly the same but it is better to talk about and understand the correct way that the system works. Rather than a mirror that reflects heat back down it is better to think of it a blanket which slows heat loss.Sure. Then would you deny that increased emissions of GHGs would likely cause a warming effect on the climate?
My response is partly covered above, but to expand. What do you think a global reconstruction is based on? Local data sets. If you take those local sets of proxies and add them together you get a global set in the same way that you can combine the readings from various temperature stations into a global temperature history. Or, and this is the method preferred by Dr. Mann and some others, you can compare the proxy record to the 20th C instrumental global set and decide that trees etc do not respond to local conditions but to global ones. Quite often all the proxies come from the NH but are calibrated against the data sets from CRU or GISS, so they are NH proxies calibrated against global temps. This is fine if you believe that a warm summer in Melbourne Australia actually effects the growth of a pine tree in Scandinavia.It's interesting that you are saying this. Mann and Jones at least in the aforementioned paper doesn't do actually do that. Here's a paragraph from their paper (emphasis mine):
Composite series were formed from weighted combinations of the individual standardized proxy series, employing weights on the individual records that account for the size of the region sampled, and the estimated reliability of the temperature signal as determined by comparison with the instrumental surface temperature record [Jones et al., 1999]. Local (decadal) correlations were calculated between each proxy record and the instrumental grid-box surface temperature records for the regions they represent over the period 1901–1980 (see Figure 1). Proxy records exhibiting negative or approximately zero local correlations (SH record #2 and #3) were eliminated from further consideration in the study.So Mann and Jones, actually take the proxy and compare it to the local instrumental record to see how accurate it is. Then they use that to weight their combinations to form the graph. I'd consider that pretty reasonable myself.
Secondly the graph you put up was of 10 reconstructions, to wit;Note that number 2 is MBH 1999 and is a NH reconstruction and not a global one. Make sure your facts and data are correct before claiming "Global" reconstructions.
That doesn't invalidate the paper I've mentioned earlier which is number 6 if you want to know. Number 7 is also global, as is number 8, and number 10 appears to be global as well.
You should also be aware that some later reconstructions actually use the result of MBH 1999 as one of their proxies. You might also want to check out Figure 5.8 in the Wegman Report which lists the proxies used in 12 studies, many of them are in your graph. Yes Samm, they do quite often use the same data, over and over again. Even when it shown to be contaminated and even when specifically told that due to confounding factors it should not be used.Okay, they do use the same proxies again and again, but they also include different proxies as well, so it's not entirely the same.
The Tiljander sediment series and Bristlecone pines come immediately to mind. The NAS said that bristlecones shouldn't be used as temp proxies due to CO2 fertilization and other factors, but I presume that since those in the NAS aren't "paleoclimatologists" or whatever they can be ignored. The Tiljander series is so contaminated by local riverworks over the last 200 years that Dr. Tiljander specifically stated that the series should not be used for temp reconstructions as due to the contamination during the entire instrumental period, it could not be calibrated with any sort of accuracy. Yet you find Tiljander in both Mann 2008 and Mann 2009 so I guess that since Dr. Tiljander goes out and gets her hands dirty her opinion about her own cores is not worth listening to. The fact that they are used upside down is a totally different point.
Explain to me the relevance of those Tijander Sediments to this graph. And in what paper was this actually published? I would like to know. I understand that the Pines were used in a number of these graphs, but that doesn't invalidate the darkest blue data set, Jones 98, the lightest blue Briffa 2001, the red-orange Huang 2004 or the darkest red, Oerlemans 2005. It doesn't really appear to matter either way, whether they include Bristlecone Pine data or otherwise, they all appear to be giving the same message.
So what is your opinion concerning those who continue to use data that is known to be wrong?Mann 2008 and 2009 are not included in that graph. I'm not even sure if those papers exist. Second of all, I'm pretty sure that not all reconstructions use Bristlecone Pine tree ring data, and yet they all seem to support each other. This article in the Guardian suggests that Mann's data although tainted in the 1999 reconstruction, was generally fairly accurate. And furthermore, those papers were published quite some time ago and I don't think they really can go back and change the data they used.
1

Having 0 kinetic energy
in Quantum Theory
Posted
I think quality shouldn't be sacrificed for speed. As far as I can tell, some of the people here on this forum seem incredibly knowledgeable within their fields (I'm definitely not one of these people). But they've got lives to lead, and don't really have a great deal of time for answering everyone's questions. Maybe it's a good idea to read good physics books. I know that when I get out of high school (this is the final year, the pressure is on!), the first things on my reading list will be penned by Richard Feynman.