


Wild Cobra
-
Posts
161 -
Joined
-
Last visited
Content Type
Profiles
Forums
Events
Posts posted by Wild Cobra
-
-
Months. You acknowledged this in post #3. Can your model account for the seasonal variation in temperature?
It most certainly can if I were to use daily, or even hourly values instead of annual. However, the percentages would be smaller.
I'm not the one making a claim. You own the burden of proof. Science discussion, remember?
The only claim I am making is that if there is a response, that if slow enough, can account for solar effect of warming into this century. I don't know if my low values of 3% or 4% is in the ballpark. I could be off. What annoys me is the certainty by you and others that it is so much higher.
(emphasis added)
Hmm. I seem to recall you berating me recently for having the audacity to assume this was a linear effect, and here you describe a linear effect. But why should it be that way?
Maybe I incorrectly assumed what you meant. Sorry if so.
Do you claim radioactive decay is linear as will, since it consistently reduced by 50% over a given number of years, and another 50% over the next step of the same number of years?
Your "equalized" plot represents what, exactly? It's not TSI, since it's a response to the radiation. Is it a proxy for the energy content of the ocean? Your model is not at all clear to me.
It's simply an unquantified value. It only shows a relative change of energy change not yet quantified. Quantification, I would leave to those who have a better tool-set for such matters.
I know we've discussed Beer's law of attenuation before, and it's in textbooks, so I doubt your claim you have never read about it.
Where's your model that shows how much of the energy gets into the atmosphere as a function of ocean depth and mixing?
I'm going by the approximate 10 meters seen in various works of spectral absorption in sea water.
Here is a image and source I will assume you will accept:

the image is from:
http://oceanworld.tamu.edu/resources/ocng_textbook/chapter06/chapter06_10.htm
It appears to me that around half the shortwave by this graph, penetrates past 10 meters. Most the ocean will fall into catagory I, II, and III.
It depends. Some opaque materials reflect well, others don't. Transparent materials can reflect approaching 100%, under the right conditions.
Didn't I elude to emissivity and re-emission of energy?
If not, I meant to. It amounts to the absorbed energy being re-emitted with Planck's law of black-body radiation. this only happens at the immediate surface of the earths surface. It doesn't apply to energy absorbed meters deep in the water.
Do you have a mechanism for this delay you posit? Because nobody else does - not here, not on Google, nowhere.
Convection, conduction, and ocean currents, after the waters absorb the energy.
Isn't it obvious?
I wouldn't recommend that course of action, but at least it will give you a chance to answer the questions I asked earlier.
Just to be clear, that's twice I have asked now.
Why shouldn't I ignore people who misrepresent my views, and argue against them?
As for your question, I have already spent too long responding today. Sometimes, i simply don't respond due to time restraints. I tell you though, I don't appreciate comments like this of yours:
I didn't jump to conclusions about what you meant: I asked you about it.
Really?:
How did you come to the conclusion that two months is the same as fifty years?
It appears you incorrectly concluded...
---
OK, does this correction help:
"Especially when longwave emitted by CO2 is absorbed and reflected within microns of the ocean surface and solar penetrates hundreds of meters."
Add re emitted as the surface acts like a black body radiator too.
How can this arbitrary choice of averaging period make a difference to whether or not the extra blanket makes the Earth hotter?I'm not sure what you mean by arbitrary averaging period. Isn't it obvious I extrapolated a response to the changing annual data provided by SORCE?
I'm also not sure what you are asking here
"In this, there is a 40 year lag claimed and accepted by those of Skeptical Science. However, it is the CO2 effect. Not solar. I will ask, why is this lag OK for CO2, but not solar? "
I am stating that skeptical science, and other sources indicate the effect of CO2 has a long equalization time. I am asking why such things are acceptable as CO2 increases, but not for solar variations.
Does it only work when something is increasing, and not when it is more cyclical?
It would appear nobody in the climate science will accept treating solar changes with equality of methodology for what appears as a lag for CO2. If heat changes from radiated down-forcing can have long term equalization, why not the sun?
0 -
Then, if you have time, tell us why you think the CO2 boost has not been trapping heat energy as the physicists say it should and everyone else thinks they have observed.
When I see an argument against an incorrect assumption, I think you are building a straw man to tear down.
I'm going to start ignoring everyone who starts off by misrepresenting my claims.
Care to be serious?
0 -
You assume twisting and bias, but unclear and incomplete explanation also fits the data. And from my perspective, your explanations are unclear and incomplete.
Then tell me what you need me to elaborate on instead of incorrect assumption. When I see an argument against an incorrect assumption, I think you are building a straw man to tear down.
Possible, sure. Science is there to assess whether or not this is reasonable, by quantifying effects and comparing to data.I see.
Even though there is no conclusive way to quantify the effect of CO2, you expect solar to be?
At first I thought you were talking about the 11 year TSI variations, but now I think you're talking about the average level of TSI. It's not clear, nor is what you mean by 3% (or 4%) equalization. I looked at your Google doc. It's a spreadsheet, or at least, that's all that appeared in my browser. It doesn't explain anything.
What is not clear about linking the SORCE data set and specifying annual? Do you see why I get so annoyed with you guys? The excel formulas are very simple. From the start, I take the 1610 TSI value for both the TSI and equalized values. In more recent spreadsheets, I changed the results to "response" from "equalized."
The formulation is:
New response level = (TSI - starting response ) x percentage + starting response
How about I explain the graph in post #8. I started with 1300 and did a single state change to 1400 and held it there. With 4.02%:
First year at change:
1400 - 1300 = 100
100 x 0.0402 = 4.02
1300 + 4.02 = 1304.02
Second year:
1400 - 1304.02 = 95.98
95.98 x 0.0402 = 3.858
1304.02 + 3.858 = 1307.878
etc. etc. etc.
Now when the data keeps changing year to year, the value added or subtracted continues to change with the TSI - response.
It is similar as half-life of isotopes, but instead of assigning years to 50%, we assign a percentage for a one year period. It is exponential, and when the data is dynamic rather than fixed, it isn't immediately apparent. Like I said before, I would prefer to use daily values.
Let's assume you idea is true. The delayed release of energy from the ocean to the atmosphere should peak 50 years after the increase has finished only if you have achieved steady-state, but you haven't. We already know that most of the energy shows up in the atmosphere fairly quickly, so the latent heating is a small fraction of the increased TSI, and the amount it deposits is less and less each year after it's deposited. What we're seeing now is the tail end of this latent heating, only a few percent of the total energy deposited, and only the energy deposited at the tail end of span — i.e. only the few years before 1958. How does that compare to the decrease in the average TSI in the last 50 years? The bulk of that energy is also released to the atmosphere quickly, with only a small fraction being delayed. Which is bigger?
How do we know most the energy show up "fairly quickly," and who are you to demand I "quantify effects" when you don't?
What is your definition of "fairly quickly?"
How does an exponential response peak? Is there some new science I'm unaware of?
As for the latency, I don't think you understand what, at least to me, the graph clearly represents.
Look closely at the graph in post 1. Any time the response signal (marked equalized) is lower than the TSI level, it increases. It increases by a constant percentage of the difference. Once they cross, and the response signal is greater than the TSI, the response now decreases. This constant dance of criss-crossing values continues to change as needed in an attempt to equalize, that will never actually happen.
As for your concept of "fairly quickly," just how quickly do you think when approximately half the shortwave entering the oceans are absorbed more than 10 meters in depth? Doesn't a substantial part of this change in solar warming go deeper, mix, and flow with the ocean currents? By "bulk," you obviously mean most of the change, but seriously... Only a small fraction is delayed? I have never seen such an idea in all the works I read. Especially when leading author say it can take decades to see the results from CO2 changes, and longwave from CO2 only penetrates the waters a fraction of a millimeter.
You have to quantify how much energy is in play, and only then can you claim that it's responsible for delayed warming. Average TSI went up by half a watt from 1860-1960. Some small fraction of that half a watt will be deposited so that it contributes later. But we already know that the 11-year TSI variations that are almost twice as big only lead to a change in temperature of just 0.1ºC. So how can a small fraction of that value as latent heating lead to anything but a small fraction of a degree?
Fully absorbed energy is not the same as longwave, that with emissivity and albedo, are "very quickly" radiated back upward. The joules of energy may be smaller, but the accumulation is different when absorbed by a mostly transparent fluid, than that of a mostly solid opaque. Which do you think is more reflective to energy?
0 -
By what mechanism, supported by what evidence?
Because no one can think of an appropriate mechanism, or anything that agrees with the measurements and evidence.
And no one can figure out what you think happened to the CO2 boost effects one would normally expect, under that scenario.
So help us out here - what are you talking about?
This isn't a science class. I'm not going to explain the basic sciences of spectral depths of shortwave, convection, conduction, etc. If these basics are not already understood, I would be wasting my time.
As for CO2, it has effect too, and I am not quantifying a temperature value by anything solar or greenhouse gasses.
Once again, I was only showing a mechanism that shows longer times involved in how the sun can influence climate.
Why are you all making more of it than what it is?
0 -
You guys are impossible. Look at what I initially responded to. iNow states:
He has this strange idea that changes from solar output take something like 30 years to manifest as changes in our climate and he calls it latency. Even if it were true (which it's not), it still cannot account for the changes we're currently experiencing.
I reply with a clarification, specifying the coupling between the solar-ocean-atmosphere, and never claim it to be more than one part of the whole:
I have a suspicion that heat changes from the sun can take a very long time to equalize to the surface and atmosphere. I may be incorrect here, but I believe it shouldn’t be an idea to be dismissed either. I personally think a single state change of the oceans surface region takes on the order of more than 50 years to equalize to 90% with the atmosphere.
What type of bias does it take to continually twist what another says? Is it your method of confirmation bias?
I am not specifying any particular period of time only stating that a annual value of equalization percentage for annual data conforms with both previous knowledge I have accumulated over more than a decade, and even with Hansen's 60% statement he once published. My 55 year for 90% belief is not necessarily true and I know that, but again, it is within Hansen's 60% for the what he has stated in the past. The 3% is even within his range.
My point is that it is possible, that until recent times, the earth has still been warming from solar increases that ended in 1958. 3% puts the peak of response in 2004. People so readily dismiss the solar influence. I think it is unwise to do so when considering the change it has on the ocean mass.
Again, this is one possibility for one the impact limited to the variables I spoke of, and still does not account for the modulating influence of other things like wind changes, ENSO, etc. It was never an attempt to be any magical explanation, other than showing the thermal inertia of systems is increasing more as their mass and size increases. The mass of the ocean surface and area coverage should not be discounted for its effect on the atmosphere, nor the fact that so much energy from the sun is absorbed into the ocean surface..
John...
You also take what I say out of context. You really got carried away with your whole earth example. I have never implied the 90% would affect be the temperature effect by that much and especially not the whole of the earth. I did specify "ocean surface region" for its effect on the atmosphere. The equalization response units are unspecified. It is just the reaction of influence to the atmosphere from heat changes in the ocean surface. It is only relative to itself, but plotted with TSI and left there to make how it responds more clear.
It is really annoying that the arrogance here has so many jumping to unfounded conclusions. If you guys call this science, then count me out. In science, one should be open and explore new ideas. Not find assumed reason to dismiss them. I repeatedly see forms of confirmation bias in these climate forums. That is not science.
Will you guys ever start actually listening to people you disagree with? Is it really so hard to try to understand another person's perspective? Seriously, your responses look absolutely ignorant to me when you keep coming back with arguments that do not apply to my posts. I see no intellectual debate from you guys because you don't take the time to ask for clarifications. Instead, you attack my position out of ignorance.
What data you use is less important if the model itself is wrong. Modeling a variable input as a step increase is wrong.
Then how does one model data that is in steps? The step is always changing with the delta of the response and new input value. Why is that wrong? Does it or does it not, properly create an exponential response?
0 -
Most times we label our axes. I assume the x axis is the year. What is y? The legend says the traces are TSI, but your values don't match with reality.
I simply used the same excel sheet and changed to a two state for illustration purposes, that it is exponential. Sorry, I thought that would be obvious.
I'm not writing a thesis or paper to be peer reviewed. Why complain about simplicity that I'm pretty sure everyone understands the intent?
And the equation that gives an exponential buildup of this sort assumes that you have, as you say, a step change in the input. But the solar variation isn't a step change, so why would this model apply? Shouldn't you be doing a sum over much smaller steps, accounting for the continual change in the input? A spike in the input should give you an immediate bump in the value, but then an exponential decrease back to the original equilibrium. It will not settle in at a higher temperature, 50 years later.
Is complete refinement necessary for purposes of illustration how something progresses?
I have wanted to use daily and uncorrected TSI values, but couldn't find any. There is something like a 7% change in value from the eccentricity of the earths orbit alone, but all I can find are normalized to 1 AU. I found it easier to use data that is accepted, like SORCE. Seems you find any reason to nit-pic anyway. Why can others use annual SORCE TSI data except me?
(also, regarding "a link to your formulation", there's rule 2.7)That's a stretch to invoke rule 2.7 when it is my own formulation of my Excel sheet that I uploaded to google docs. The graphics are mine too, generated on my computer, uploaded to my photobucket account.
Again, how can one who assumes so many things as fact, be qualified as a moderator.
0 -
So, what contention do they support?
That there is spiteful bias.
Anyone who disagree with consensus is treated so much different than those making looser statements that do support consensus.
Now that I got my graph in on the other post, and said my piece. I just might not come back again. I'm tired of this "clique" like environment.
0 -
Since you explain very little, all I really have is assumption. And asking for clarification.
Why would it equal 1? You said that it's reaching 90%. Of something — that part's not really clear.
I gave a link to my formulation.
It's exponential. If I do a single state change with my formulation we get this:
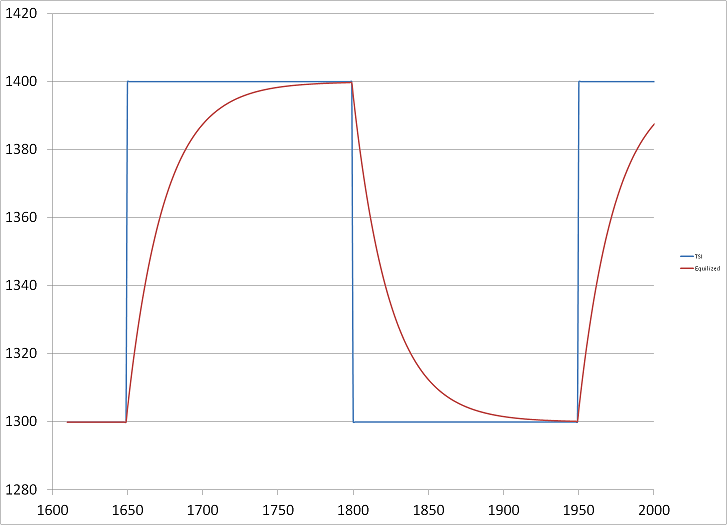
90% is at 55 years.
Another thing when speaking of equalization, it is rarely stated at what percentage. One of Hansen's papers... says something to the effect that 60% of the equalization occurs in... I think 20 to 30 years. This too, matches. I haven't found that paper as I looked, but there is something to that effect.
Any time equalization is mentioned, a percentage of equalization needs to be stated with it, else it's meaningless. After all, it takes infinity for exponential changes to reach 100% of the change.
0 -
I think you gave two examples just fine to support my contention.
In the first "this," I stated what I thought I read by saying "If I read that correctly..." I then asked questions about it.
In the second "this," I stated that some of this was very old. I used a 10 year reference. Can you find material from 10 years back with ease? And should I when I was being asked to source an opinion in a thread called "Who here is a global warming skeptic?"
I have been hounded at every turn for any little reason.
In a recent post in another thread, you assume incorrect facts and accuse me of assuming linear, when what I did is clearly exponential... that is when one is considerate enough to assess a persons works rather than ignore, and go into auto-deny mode as you have frequently done with me.
You know, I don't care any more. Someone who assumes so incorrectly, so frequently, like you... should not be a moderator.
Suspend me if you want. Ban me if you want. This forum has become beneath me because of people like you!
-2 -
Why would you expect this to be linear, as opposed to e.g. an exponential? We know the absorption of light is an exponential reduction, so why would the energy that gets deposited deeper and requires mixing to get to the surface be a simple fraction of the total energy?
Why are you assuming? I never indicated a linear response. Did you look at my formulation?
Since when does 0.0402 x 55 = 1?
0 -
Why do you think this?
Are you aware that the data shows that the sea temperature varies with the seasons -i.e. on a much shorter time-scale than 50 years.
http://www.seatemperature.org/europe/united-kingdom/aberdeen.htm
http://www.seatemperature.org/europe/united-kingdom/penzance-february.htm
The fact that the peak temperatures ( July August) are slightly later than the peak sunshine (June) tells you that the delay between the sun's effect and the temperature change is about a month or two.
How did you come to the conclusion that two months is the same as fifty years?
I don't discount the two month apparent lag at all. We all witness that the two annual solaces are late June and late December, but the temperature peaks are usually August/September or January/February.
I am simply saying that there are likely more changes, that are slower at responding as well.
Now I have complained about using blogs, but in a short time frame, I didn't find what I was looking for except for this:
http://www.skepticalscience.com/Climate-Change-The-40-Year-Delay-Between-Cause-and-Effect.html
In this, there is a 40 year lag claimed and accepted by those of Skeptical Science. However, it is the CO2 effect. Not solar. I will ask, why is this lag OK for CO2, but not solar? Especially when CO2 is absorbed and reflected within microns of the ocean surface and solar penetrates hundreds of meters.
There are past papers where Hansen speaks of various lag timeframes regarding CO2, I believe as far out as 60 years, but I would have to find it again for certainty. If pressed, I will find one of them, but is it necessary? It seems to me Skeptical Science is the "go to" place for many of the claims.
Again, why not for solar as well if it is claimed for CO2?
John...
Maybe you disagree with the time involved, but do you see a problem in my formulation for equalization?
Maybe my 3% or 4.02% is wrong. maybe it's 50% or 80%... Maybe more...
Just the same, what about my methodology rather than percentages?
0 -
At the risk of responding to a moderator thread, I would be glad to have a proper thread to disuss this topic, without the fear of suspension.
By all means Imatfaal. I welcome a proper thread.
0 -
So not "threatening the consensus" then. Why do you feel the need to play the martyr, instead of discussing the science?
I was taken out in my opinion for what ever angle I could be, because I can threaten consensus. Once I said i would show an example once I saw one again, I was hounded and hounded. I was baited into that suspension for holding firm.
How about we discuss the science instead of such things as you bring up?
Don't you get it? My viewpoint of science has been censored. If I'm not careful, I will be suspended again. Maybe banned.
Strange...
How about responding to my viewpoint on science instead. Do you agree or disagree that my methodology for the graph I made has merit? Maybe not the year to year percentage, but what about the methodology?
If there is a better forum to discuss this, I will be glad to. Just start a thread and invite me. Otherwise, I would prefer to stick with the science instead of being baited into another suspension.
-1 -
As far as I am aware, nobody has been banned for threatening the consensus.
Before you go any further, perhaps you would like to cite some evidence for that claim.
Suspended at least.
That's how you guys set it up. You know the rules and how the moderators respond. I was suspended for a week for not digging into a claim I made before. I said I would provide it the next time it presented itself. My initial claim was not to believe any blog, including those from skeptics. It snowballed into a suspension for me of a week:
http://www.scienceforums.net/topic/29763-bannedsuspended-users/?p=838272
My offense was not allowing the thread to be sidetracked farther, and refusing repeated demands.
Now here we are again...
-1 -
He has this strange idea that changes from solar output take something like 30 years to manifest as changes in our climate and he calls it latency. Even if it were true (which it's not), it still cannot account for the changes we're currently experiencing.
I have been apprehensive about showing how solar can possibly affect more recent times because it appears to me that the moderators are quick to suspend or ban anyone who threatens the consensus.
For me, it’s a question about how long it takes for the shortwave that penetrates the ocean and heat equilibrium to manifest itself. I don’t have an answer for this with any certainty, and have contemplated starting a thread in Speculations forum. Still, I will now, simply ask that people here consider the fact that larger masses take longer to do equalize.
I have a suspicion that heat changes from the sun can take a very long time to equalize to the surface and atmosphere. I may be incorrect here, but I believe it shouldn’t be an idea to be dismissed either. I personally think a single state change of the oceans surface region takes on the order of more than 50 years to equalize to 90% with the atmosphere. I don’t recall if I used this number in these forums, but I have settled for 55 years some years back. Now if we use annual equalization of a percentage for the difference between a response level and TSI, it would be at a rate of 4.02% per year.
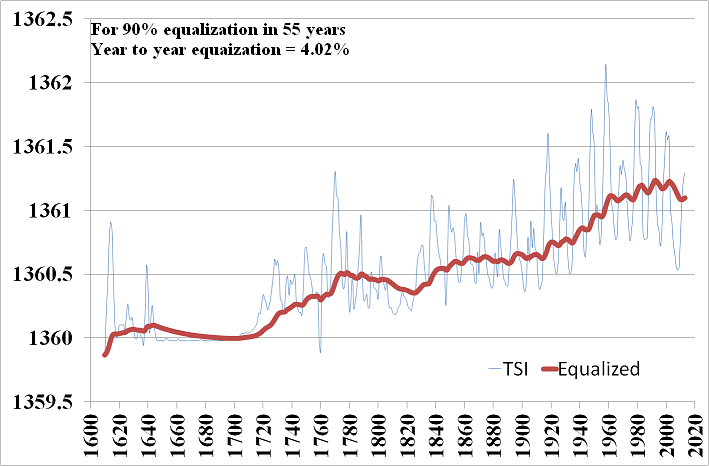
Please keep in mind that I don’t believe these numbers as fact, it just fits what I have observed in my search for the truth. A 3% equalization response has the peak equalization response at 2004, which could explain the hiatus of warming we have when including other fators.
For anyone curious how I have calculated these, here is a methodology:
https://docs.google.com/spreadsheets/d/1PZCjt-YyUeQzxZVL73_O4FmZzyF9nqmBhq6eqfGTmMg/edit?pli=1#gid=0
The data I used is from using the SORCE TSI reconstruction. The peak TSI is at 1958, but if equalization is a slow as I believe it to be, it still takes a long time to equalize after that.
http://lasp.colorado.edu/data/sorce/tsi_data/TSI_TIM_Reconstruction.txt
I guess I’m ready to defend my position. I just wish the people here would be more open to ideas outside of consensus.
-1 -
[because]
“…it will be many decades, perhaps longer, before the signal of human caused climate change
can be detected in the statistics of hurricanes …floods, tornadoes and droughts….”
On the "many decades." Isn't it equally likely that the signal from solar changes may also take several decases?
0 -
For those curious, it was a bunch of accusations about activist blogs and lacked any specific challenges to the central points... Basically, several paragraphs of attacking the messenger and trying to poison the well. That said, it wouldn't be fair IMO to accuse him of a "dog ate my homework" excuse.
My point was already made. The definition of words have specific meanings. Those who purposely misuse words to mislead, are not to be trusted.
0 -
Models...
And in response, you state that 2013 was somewhat quiet and that my link is not from this year and the journal Nature and the EPA are "agenda driven blogs." You also commented about a graph being inaccurate, despite the fact that I've shared no graphs in this thread.
Not even wrong...I said no such thing about Nature and the EPA. I'm speaking of the graph you presented in the polar bear thread. It is innacurate and from an agenda driven site, along with three of the four links in the later post.
I highly suggest you research your graphs and links for accuracy before you post them when obtaining them from activist sites, because they most certainly show you in a poor light...
-1 -
Not that any of this will matter given that you're mind is made up and you are impervious to facts in disagreement with your preconceptions...
Well, I went through and listed why every one of those links and graphs were wrong. I decided not to post it, because this is a tangent not needed.
Words have meaning and all you provided was useless graphs made by bloggers using reputable data, and renaming graphs. Even the quote you provided by the CBO is altered in your presentation of it from the actual quote.
0 -
iNow...
Too bad the Farmers Almanac accurately points out 2013 was a quiet one. What you cite is another failed prediction I think.
The 2013 Hurricane Season SummaryReference Source: Department of Atmospheric Science at Colorado State University (CSU).
Last year's hurricane season ended up being one of the quietest on record, even though all major hurricane forecasters expected a very busy, above-average season. Typically, strong waves come up from the south off the coast of Africa, bringing the rich moist air that generates hurricanes; this year, however, there was unusually dry air from the Sahara plus the winds came down from the north (also dry), so hurricane conditions just did not exist.
The 2014 Hurricane Season ForecastFor the 2014 season, experts predict a below-average number of hurricanes and below-average landfall. This is based on two key factors: a cooler tropical Atlantic and a developing El Niño. If the oceans warm and the tradition to the El Niño slows, the season could heat up.
http://www.almanac.com/content/hurricane-forecasts-and-common-questions
Don't you ever validate years old links before posting them? That Nature link is from 2010 and you should have verified it's accuracy. Unverified old predictions, innacurate graphs from agenda driven blogs, what else is up your sleeve?
-3 -
OK, I stand corrected.
Still nervous about spreading it all over the place, but that might be my general dislike for an industry which keeps telling me it's safe and then having accidents which result in bits of the planet being uninhabitable for thousands of years.
Now I could be in error, but I don't think I am. As long as depleted uranium remains in it's solid metalic form, or as a coloring in glass, etc. It is no threat. Once you atomize it or liquify it, then it becomes a toxicity problem.
There are elements in our daily lives more radioactive than depleted uranium.
How much radioactivity does your smoke alarm, produce?
Wrist watch?
Medical equipment?
Potassium? 0.012% of potasium is of the radiactiove isotope. How much potasium do you consume daily?
0 -
60 years isn't that long in climate timescales.
I'd suggest looking at something like this:
http://www.aoml.noaa.gov/hrd/tcfaq/E11.html
It's not a graph but I'm sure one could be found or u can plot one from this. Might be easier to compare to your solar cycle data then.
But to be clear, I think that more energy in the atmosphere (warmer) = more energetic weather = worse storms on average.
I will suggest it is hard to base anything accurate with older records. It'sn't it hard to accurately count these events before the use of satellites? More modern events include storms that never make it to population centers.
Am I wrong about this?
0 -
We demand it of the consensus, so we're just trying to be consistent. Is there a problem?
It sure doesn't seem that way.
0 -
A major part of the AGW doctrine is that the influence of rising CO2 levels will bring about increasing incidence and severity of extreme weather events, most recently loudly trumpeted regarding Hurricane Sandy. So what does the historical record tell us?
A completely different story, that's what. Instead of rains of blood and frogs, plagues of locusts and acne, we find relatively docile storm seasons around the globe as CO2 levels relentlessly creep upward. Don't take my word for it look for yourselves. If CO2 levels are the DOMINANT factor in climate why not give credit where credit is due?
Because only nasty weather has anything to do with global warming according to said doctrine, res ipsa loquitor.
I think you have a point, but this forum does demand evidence when it is contrary to the consensus.
Maybe this will help:
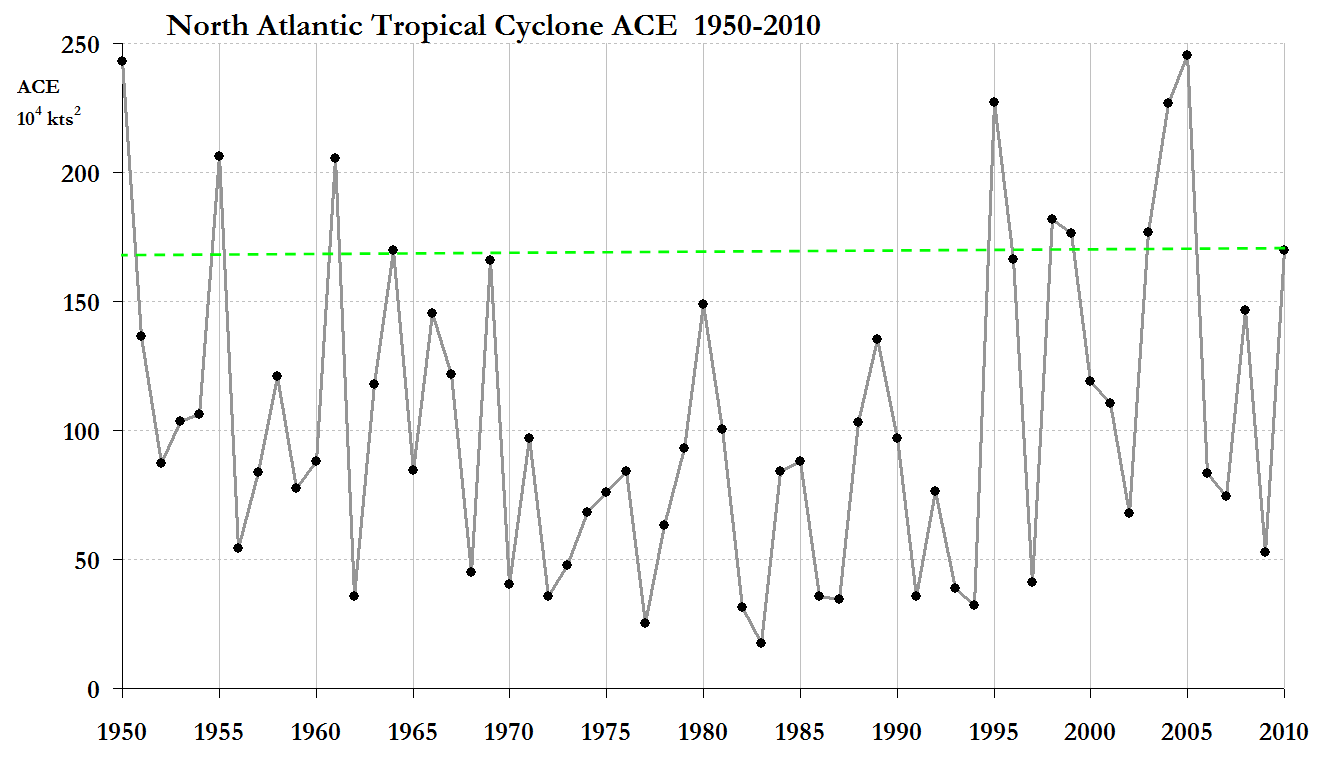
Now it appears to me that a curve can be drawn through the graph going high, to low, and high again bottoming out in the early 80's. The TSI peaked in 1958 with a value of 1359.9801 W/m^2 according to the SORCE site. The next peak was lower in 1970 at 1359.9785 W/m^2. Each peak since has been higher than the 1970 peak until this most recent one. The data stops at 2013, and it is lower than 1970.
Anyway, I agree the tropical storms do not seem to track with CO2, and I believe they track better with solar changes. However, better evidence needs to be provided to these people. I cannot provide that evidence now, but maybe what I provided can help you find better information to use.
SORCE data:
http://lasp.colorado.edu/data/sorce/tsi_data/TSI_TIM_Reconstruction.txt
 0
0
Reaction of Earth to Changes in Total Solar Irradiance
in Climate Science
Posted
I gave it to you. It doesn't matter to me what you believe of it.